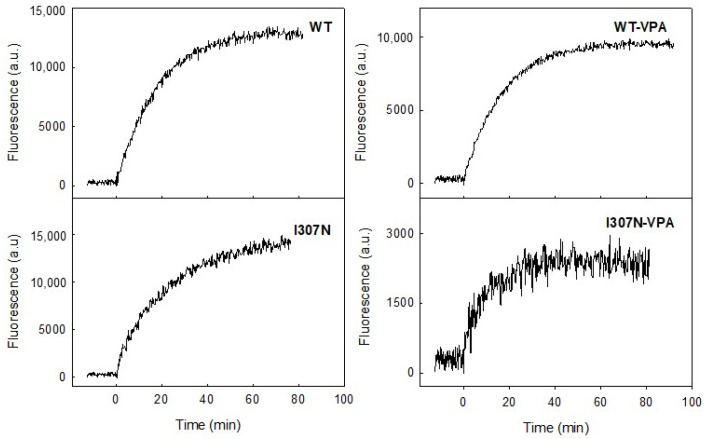
Figure 5.
Fluorescence Retinal Release Curves: The figure shows representative curves for the purified Rho WT and mutant samples measured by means of fluorescence spectroscopy (the I307N mutant without and with VPA treatment is shown in comparison to WT Rho). The fluorescence curves represent the retinal release from the Rho binding pocket which closely parallels the Meta II decay process. The protein samples were incubated at 20 °C until a steady baseline was obtained, they were subsequently photobleached and the Trp fluorescence increase was monitored over time. The fluorescence increase curve was fit to a single exponential function and the t1/2 obtained.

