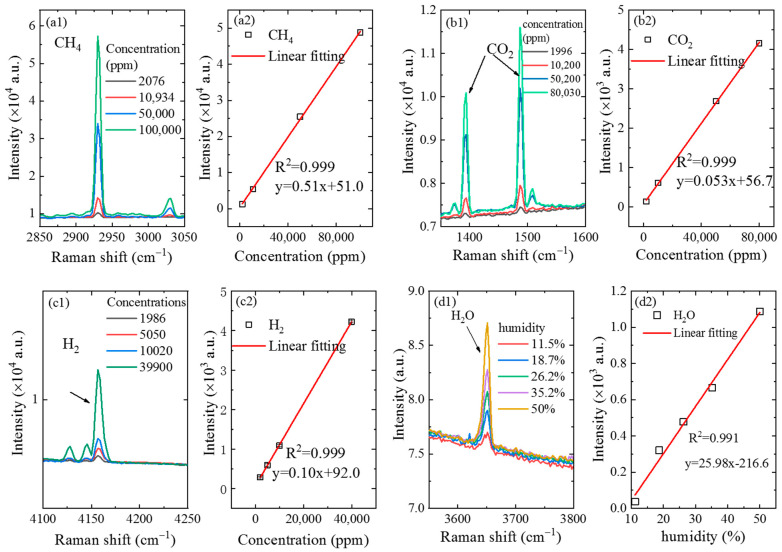
Figure 4.
Raman spectra and calibration curve of gas samples in different concentrations obtained by the CERS probe. (a1) Raman spectra of CH4; (a2) calibration curve of CH4 based on the peak intensity with Raman shift of 2917 cm−1; (b1) Raman spectra of H2; (b2) calibration curve of H2 based on the peak intensity with Raman shift of 4156 cm−1; (c1) Raman spectra of CO2; (c2) calibration curve of CO2 based on the peak intensity with Raman shift of 1387 cm−1; (d1) Raman spectra of water vapor; (d2) calibration curve of H2O based on the peak intensity with Raman shift of 3650 cm−1.

