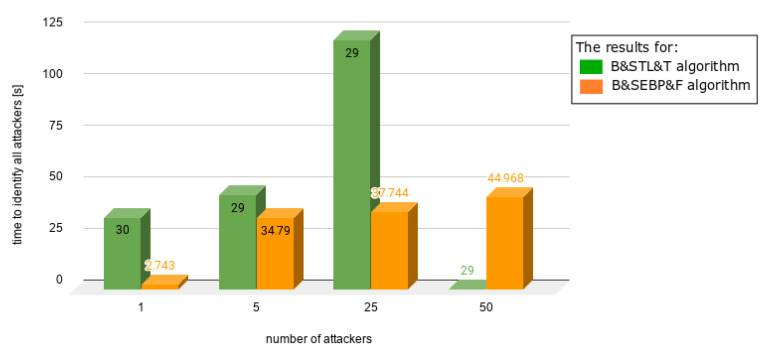
Figure 11.
Results from experiments no. 4, 5, 6, and 7 (experiments can be found in Table 3, Table 4, Table 5, Table 6 and Table 7); the graph presents different scenario when the number of users increased significantly as well as number of attackers; the ratios between the attackers and users were 1.96%, 9.05%, 33%, and 50%.

