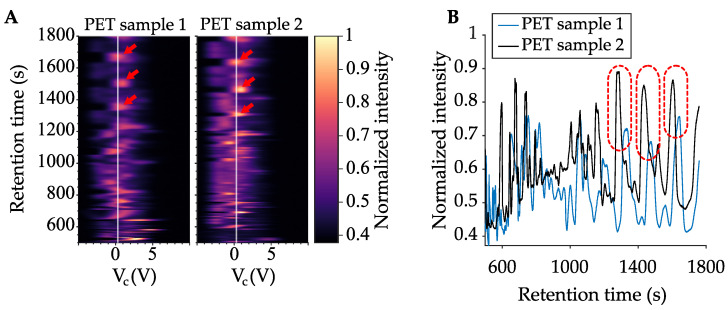
Figure 5.
(A) Representative Py-GC/DMS data for two PET samples analyzed 3 months and 15 days apart with the same system, between which the system was used on other samples. (B) Ion intensity (V) at the electrometer is plotted versus retention time at a constant V [V = 0.3 V, drawn as a white line in (A)]. Three peaks are circled in red and show the correspondence between samples. Red arrows point out the same peaks in the left plots.

