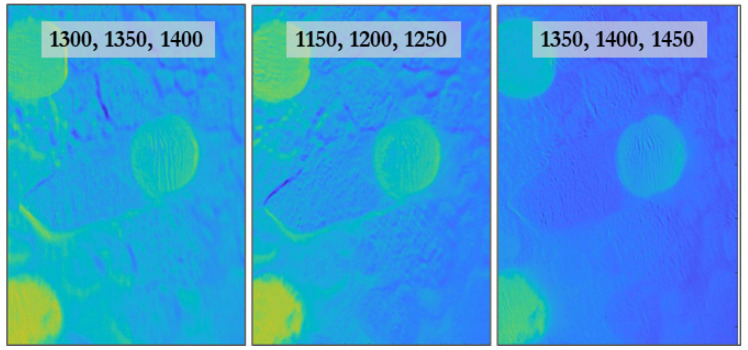
Figure 8.
Each panel shows processed images of PP MP where the reflectance contrast at SWIR active wavelengths is drawn from neighboring wavelengths where absorption is lower. The three wavelengths listed in a panel each correspond to a filter. The middle wavelength is the reflectance value that is compared to the other two using a modified band depth analysis [57]. For instance, the middle panel shows reflectance strength at the key 1200 nm wavelength as contrasted to that of neighboring 1150 nm and 1250 nm wavelengths. The green-yellow color indicates a stronger absorption feature (lower reflectance) while the blue indicates a lack of feature presence.

