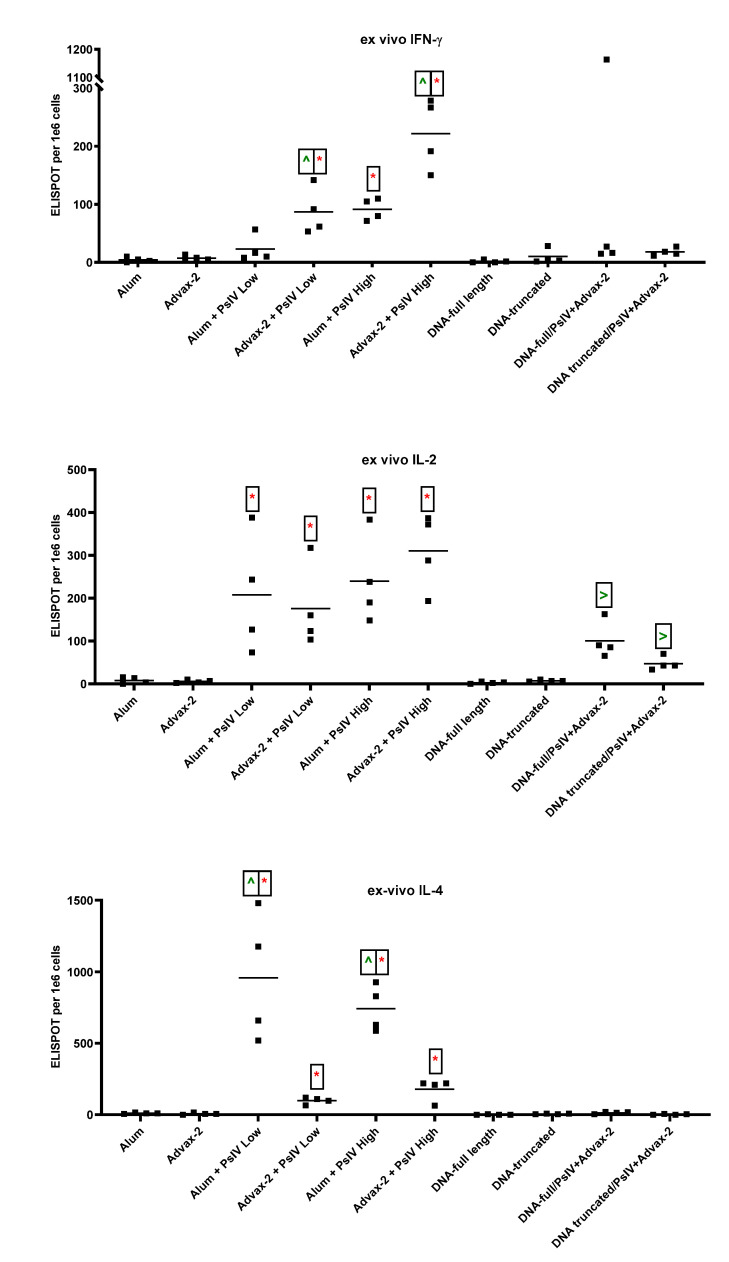
Figure 5.
Ex vivo ELISPOT for IFN-γ, IL-2, and IL-4. Mouse splenocytes were used for ELISPOT assays. Data are presented as spot-forming units (SFUs) per 1 × 10⁶ cells. Each symbol represents one mouse, and horizontal lines represent group median values. Student’s t-tests were used to compare differences between groups. * indicates significant differences (p ≤ 0.05) between the adjuvant and PsIV group vs the corresponding adjuvant alone group. ^ indicates significant differences between alum and PsIV (high or low dose) groups vs the corresponding Advax-2 and PsIV dosage groups. > indicates significant differences between the DNA vaccine alone groups vs the corresponding DNA/PsIV prime-boost groups.

