Figure 2.
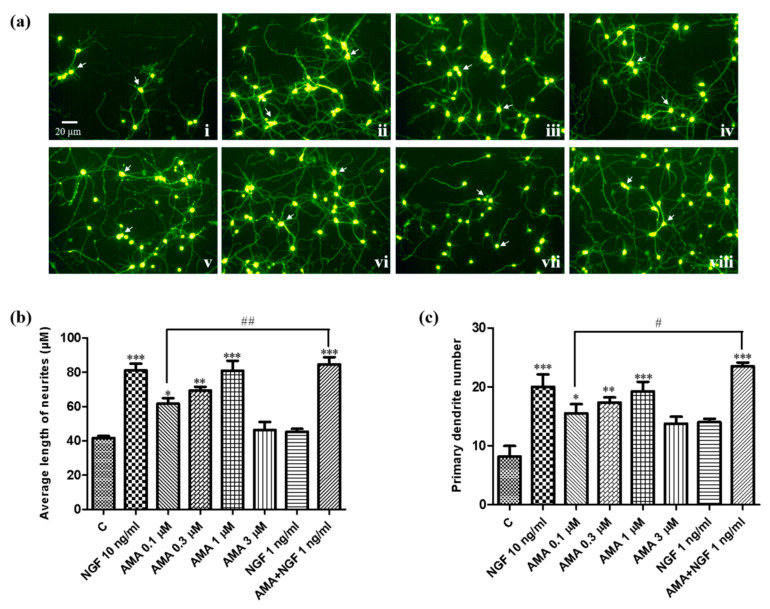
Neurogenesis effect of AMA in primary cortical neuron cells. (a) Micrographs of primary cortical neuron cells at 48 h after treatment with (i) control (0.5% DMSO); (ii) NGF (10 ng/mL); (iii) NGF (1 ng/mL); (iv) AMA (0.1 μM); (v) AMA (0.3 μM); (vi) AMA (1 μM); (vii) AMA (3 μM); (viii) AMA (0.1 μM) + NGF (1 ng/mL). (b) Average length of neurite outgrowth of the indicated groups in the primary cortical neuron cells. (c) Average primary dendrite number in each group. Each experiment was repeated three times. The data were expressed as a mean ± SEM. *, ** and *** indicate significant differences at p < 0.05, p < 0.01 and p < 0.001 compared with the negative control; #, ## indicate a significant difference at p < 0.05 and p < 0.01 compared with the 0.1 μM AMA group.

