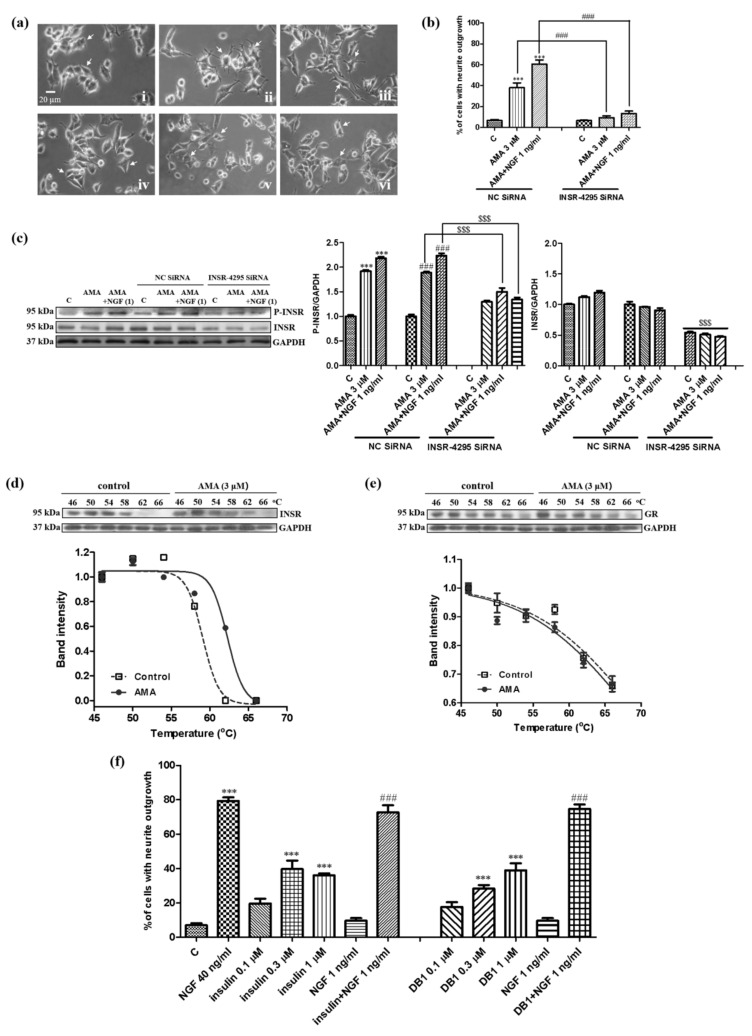
Figure 6.
Target prediction of AMA in PC12 cells by using siRNA and a CETSA assay. (a) Microphotographs of PC12 cells after treatment with siRNA and AMA or AMA combined with the NGF: (i) negative control siRNA, control (0.5% DMSO); (ii) negative control siRNA, AMA (3 μM); (iii) negative control siRNA, AMA (3 μM) + NGF (1 ng/mL); (iv) insulin receptor siRNA, control (0.5% DMSO); (v) insulin receptor siRNA, AMA (3 μM); (vi) insulin receptor siRNA, AMA (3 μM) + NGF (1 ng/mL). (b) Percentage of cells with a neurite outgrowth after treatment with siRNA and AMA or AMA combined with the NGF. (c) Western blot analysis for the insulin receptor after transfection with negative siRNA or insulin receptor siRNA and treatment with AMA or AMA combined with the NGF. Cells were transfected with Lipofectamine 2000 and 150 nM siRNA for 6 h and treated with AMA or AMA combined with the NGF. (d,e) CETSA of PC12 cells on the insulin receptor or GR protein and corresponding fitting curves. (f) Neuritogenic activity of insulin and demethylasterriquinone B1 in PC12 cells. ***, ### and $$$ indicate significant differences at p < 0.001 compared with the corresponding groups.

