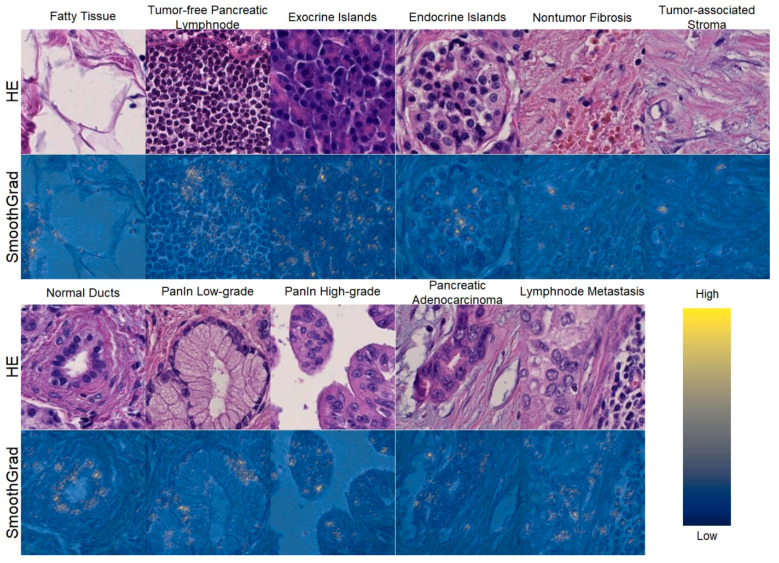
Figure 4.
SmoothGrad heatmaps of exemplary image patches that have been classified correctly and highlight cellular structures. For each class, the upper plot shows the original image patch, while the lower plot shows the patch overlaid with the SmothGrad heatmap in respect to the class of the image patch. High SmoothGrad activity scores can be seen in areas overlaid with cells or nuclei. This confirms that the algorithm classified the image patches based on cellular morphology. Scale: each image 100 × 100 µm (219 × 219 px).

