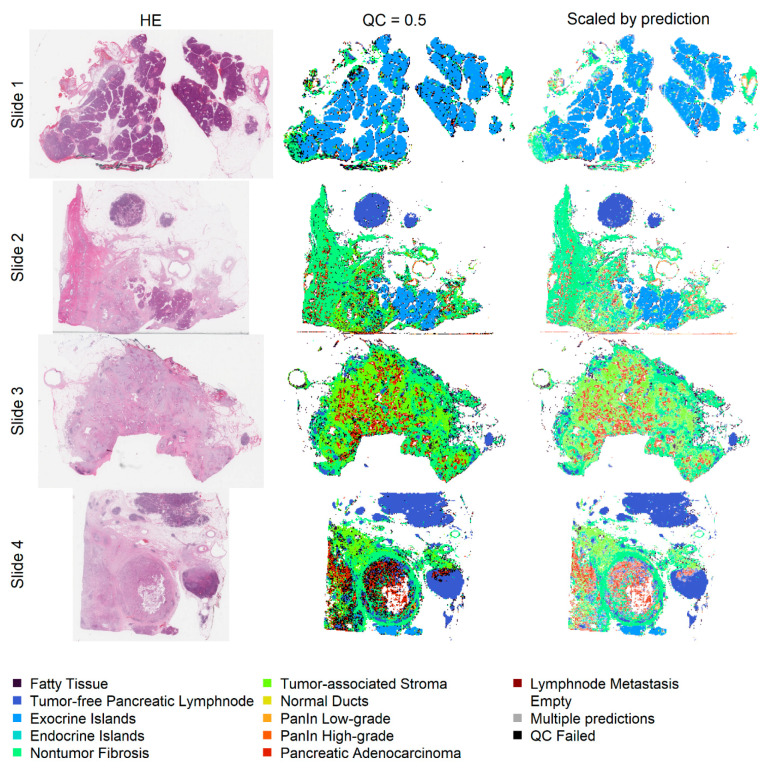
Figure 5.
The first column shows the original slides, the second column shows the patch classification heatmaps with a QC of 0.5, and in the last column, the patch color is mixed with white depending on the prediction probability (1 results in no mixing with white). Non-tumor pancreatic tissue (first row), areas with a high content of pancreatic adenocarcinoma (second to fourth rows), and lymph node metastases (fourth row) can be easily identified.

