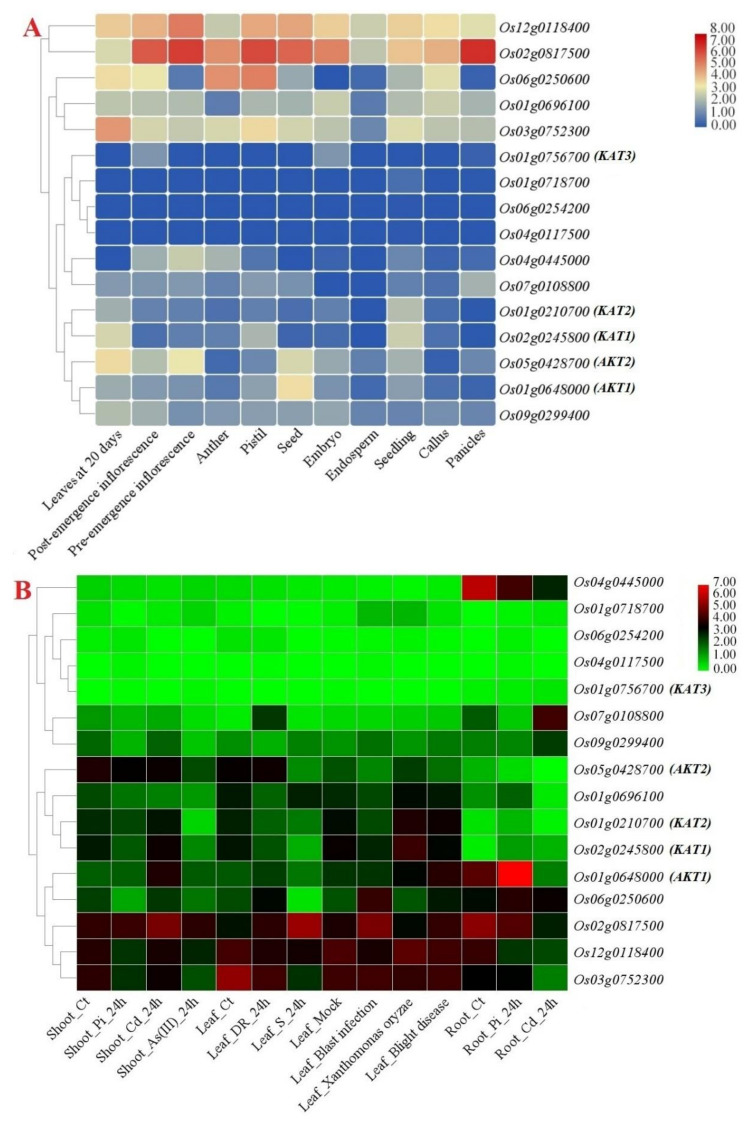
Figure 8.
Expression heatmaps of K+ channel genes in rice from different tissues (A) and in response to abiotic and biotic stresses (B). The studied conditions included control (Ct); phosphate starvation (Pi), cadmium (Cd), drought (DR), salinity (S), and arsenic (As) stresses; and pathogens. Heatmaps were generated based on the log-2-transformed RNA-seq fragments per kilobase per million fragments mapped (FPKM) magnitudes in the exons of the rice genome.

