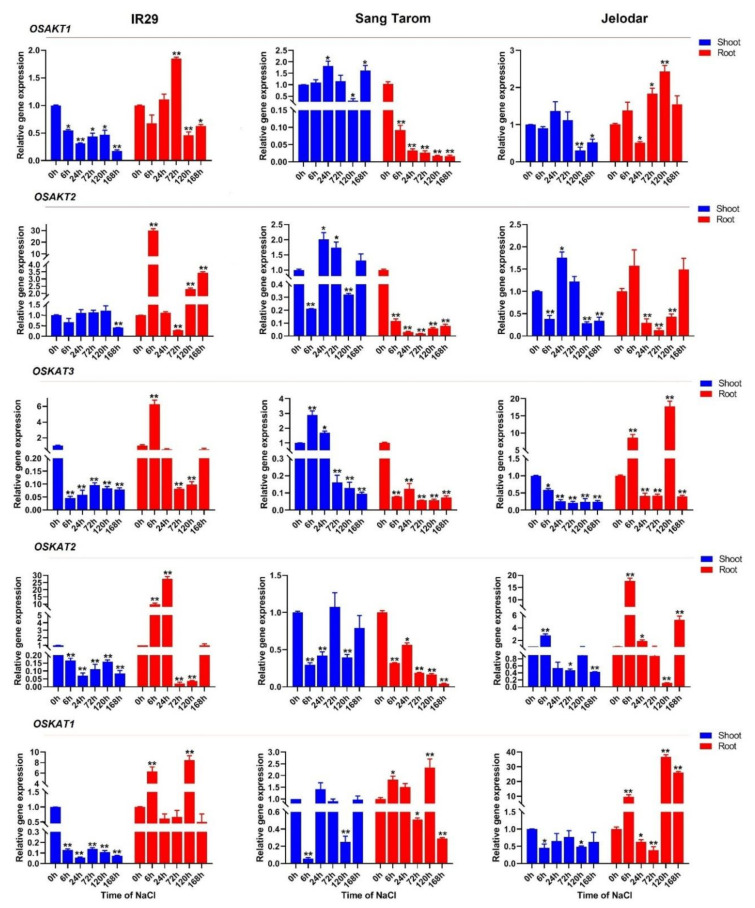
Figure 10.
Relative expression levels of OsAKT genes (OsAKT1 and OsAKT2) and OsKAT genes (OsKAT1, OsKAT2, and OsKAT3) in the shoot and root tissues of three rice cultivars, IR29 (susceptible cultivar), Sang Tarom (moderately tolerant cultivar), and Jelodar (moderately susceptible cultivar), in response to NaCl stress at different time courses. The values are given as the means ± SDs of three biological replicates, and the * and ** above the bars show a significant difference (according to Student’s t-test) between the applied treatments and the control at p < 0.05 and p < 0.01, respectively.

