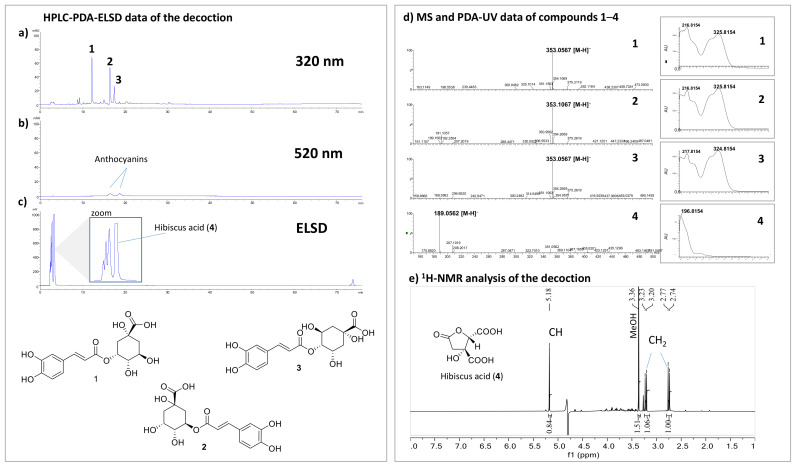
Figure 3.
HPLC-PDA-ELSD analysis of HS decoction: (a) PDA detection at 320 nm; (b) PDA detection at 520 nm; (c) ELSD detection. UHPLC-PDA-MS analysis (d); MS and UV spectrum of compounds 1–3; (e) 1H-NMR analysis of HS decoction in a deuterated phosphate buffer (pH 7) containing 0.9 mM of TSP (sodium trimethylsilyl propionate). The signals of hibiscus acid (4) are highlighted.

