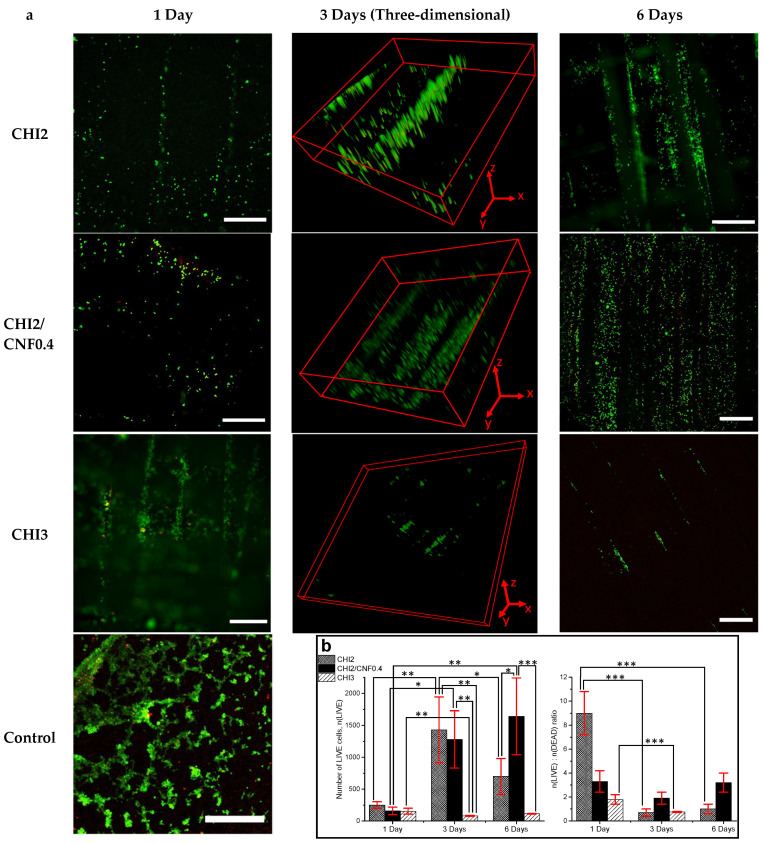
Figure 9.
(a) LIVE/DEAD assay confocal laser scanning microscopy (CLSM) images after culture of NIH/3T3 fibroblast cells in 3D printed CHI/CNF hydrogel composite scaffolds of different CHI and CNF concentrations (Figure 8). LIVE indicator: green fluorescence; DEAD indicator: red fluorescence. Scale bars: 500 μm. Three-dimensional frames (3 days) scale: CHI2) x*y*z: 2.3*2.3*0.075 mm3; CHI2/CNF0.4) x*y*z: 2.3*2.3*0.50 mm3; CHI3) x*y*z: 3.0*3.0*0.15 mm3. (b) (Left) Number of LIVE cells n(LIVE); (Right) n(LIVE)/n(DEAD) cell ratio obtained for the different CHI/CNF formulations at the different days, expressed as means ± SDs, n = 4 (* p < 0.05, ** p < 0.01, *** p < 0.001).

