

Abstract
Background
Some renal biopsies cannot distinguish minimal change disease (MCD) from primary focal segmental glomerulosclerosis (FSGS) because of inadequate sampling and/or a lack of sampled glomeruli with segmental sclerosis. As protein excretion in MCD has been described as being albumin-selective, we examined whether the ratio of immunoglobulin G (IgG)/albumin staining in protein reabsorption droplets (tPRD) might help distinguish MCD from FSGS.
Methods
Frozen tissue from 144 native renal biopsies from patients with nephrotic syndrome and a diagnosis of MCD or FSGS [73 MCD, 30 FSGS tip variant (FSGS-tip), 38 FSGS-not otherwise specified (FSGS-NOS), 3 FSGS collapsing] was retrospectively stained by direct immunofluorescence for IgG and albumin; none of these samples showed diagnostic lesions of FSGS. IgG and albumin staining of tPRD were graded on a scale of 0 to 3+ based on the distribution and intensity of staining.
Results
Mean (standard deviation) IgG/albumin staining ratios were 0.186 ± 0.239 for MCD, 0.423 ± 0.334 for FSGS-tip (P = 0.0001 versus MCD) and 0.693 ± 0.297 for FSGS-NOS (P < 0.0001 versus MCD; P = 0.0001 versus FSGS-tip). Of 84 biopsies with a ratio ≤0.33, 63 (75%) showed MCD, whereas among 21 with a ratio of 1.0, all but one showed FSGS (15 FSGS-NOS).
Conclusions
In summary, IgG/albumin staining in tPRD was correlated with histologic diagnosis in renal biopsies with MCD and FSGS. A ratio of ≤0.33 was associated with MCD, whereas a ratio of 1.0 was most often seen with FSGS-NOS.
Keywords: focal segmental glomerulosclerosis, IgG/albumin staining ratio, minimal change disease, protein reabsorption droplets, renal biopsy
INTRODUCTION
The glomerular filtration barrier to protein is composed of fenestrated glomerular endothelium, the glomerular basement membrane (GBM) and filtration slits formed by podocyte foot processes. The negative charge, size and shape selectivity (hypothetical cylindrical ‘small pores’ and ‘large pores’) of the glomerular filtration barrier determine the permeability of proteins [1]. Albumin, the most abundant plasma protein, is small enough (36 Å) to pass through ‘small pores’; however, it is highly anionic at physiologic pH. In contrast, IgG is larger (55 Å) and mostly neutral or cationic. Because of their respective sizes and charges, under physiological conditions albumin and IgG are both transported through ‘large pores’. The loss of albumin without immunoglobulins indicates a reduced negative charge of the GBM [1] as illustrated in minimal change disease (MCD), whereas the loss of high molecular weight proteins, such as immunoglobulins, implies structural changes involving ‘large pores’ of the glomerular barrier [2]. Filtered albumin is primarily reabsorbed by megalin-/cubilin-mediated endocytosis in proximal tubules [3, 4]. The amount of albumin in the urine is considered to be the result of a balance between glomerular filtration and tubular reabsorption, with filtered albumin considered to be the major source of urinary albumin.
Urinary excretion of high molecular weight proteins is theoretically regarded as a marker of damage severity to the glomerular capillary filtration barrier. Immunoglobulin G (IgG) is most commonly used as the high molecular weight protein marker, although alpha 2-macroglobulin and immunoglobulin M have been used in other studies [5]. Selectivity index (SI), a comparison of the clearance of IgG to that of albumin (IgG clearance/albumin clearance), is used to measure the selectivity of protein excretion and the ability of the damaged glomerular filtration barrier to discriminate between protein molecules of different sizes [6–9]. Based on SI, the pattern of glomerular proteinuria is described as selective or nonselective. High selectivity of urinary albumin excretion is predictable for response to steroid treatment in both adults and children with nephrotic syndrome (NS) [6–8, 10, 11], but does not predict subsequent relapses in responding patients. Histologically, selective proteinuria is highly associated with MCD, whereas nonselective proteinuria is classically seen in severe glomerulonephritis. The correlation between selectivity and renal biopsy morphology is not well established [7–9, 12]. Notably, SI has rarely been used in clinical practice since its introduction in 1960s, due to disagreement regarding the suitability and accuracy of SI measurement.
In patients with NS, some renal biopsies cannot distinguish MCD from primary focal segmental glomerulosclerosis (FSGS) because of inadequate sampling and/or a lack of sampled glomeruli with segmental sclerosis in cases of early FSGS. Considering the selectivity of proteinuria in MCD, we hypothesized that the ratio of IgG/albumin staining of proximal tubular protein reabsorption droplets (tPRD) by immunofluorescence (IF), which likely reflects the ratio of these proteins in glomerular filtrate, might be higher in FSGS than in MCD, and potentially allow distinction between these two lesions. We therefore examined IgG/albumin staining ratios in tPRD in frozen samples from renal biopsies of patients with NS and a diagnosis of MCD or FSGS.
MATERIALS AND METHODS
At our center, frozen tissue processed for routine IF staining of renal biopsies is routinely stored at −70°C after its use in routine diagnostic testing. For this study, we reviewed computerized pathology records from Cedars-Sinai Medical Center and selected all native renal biopsies processed from January 2013 through December 2016 with a primary diagnosis of MCD or FSGS in patients with NS defined as proteinuria of ≥3.5 g/day or urine protein/creatinine ratio ≥3.5 with peripheral edema, and frozen remaining renal cortical tissue with three or more glomeruli. Patients with known secondary causes of FSGS (underlying immune complex-related glomerular disease, thrombotic microangiopathy or diabetic nephropathy, human immunodeficiency virus, obesity, solitary kidney, atheroembolic disease, treatment with lithium or pamidronate) were excluded. This yielded a total of 175 biopsies; 31 of these were excluded to reduce the chance for observer bias because FSGS lesions were noted to be present on the frozen sections of the tissue when it was processed for IF at the time of diagnosis. Table 1 shows the clinical characteristics of the remaining 144 patients at time of biopsy. Two patients had weakly positive antinuclear antibody (ANA) (1:80) without immune deposits by IF or electron microscopy. Of the 144 biopsies, 73 showed MCD, 30 FSGS tip variant (FSGS-tip), 38 FSGS-not otherwise specified (FSGS-NOS) variant and 3 FSGS collapsing variant (FSGS collapsing). Table 2 shows the pathologic features of the biopsies.
Table 1.
Clinical characteristics at time of biopsy
| Characteristic | MCD (n = 73) | FSGS-tip (n = 30) | FSGS-NOS (n = 38) |
|---|---|---|---|
| Age [mean (range)], years | 45.9 (5–94) | 46.5 (16–85) | 38 (16–80) |
| Female, n (%) | 37 (51) | 14 (47) | 17 (45) |
| Full NS, n (%)a | 61 (84) | 26 (87) | 31 (82) |
| Microscopic hematuria, n (%) | 14 (19) | 6 (20) | 5 (13) |
| Renal insufficiency, n (%)b | 24 (33) | 18 (60) | 22 (58) |
Includes serum albumin <3.0 g/dL in addition to nephrotic range proteinuria and edema.
Serum creatinine above or estimated glomerular filtration rate below normal range for age, or specifically stated in clinical history.
Table 2.
Summary of renal biopsy findings
| Biopsy findings | MCD (n = 73) | FSGS-tip (n = 30) | FSGS-NOS (n = 38) |
|---|---|---|---|
| Number of glomeruli [mean (range)] | 25 (5–83) | 25 (7–61) | 20 (3–59) |
| Percent globally sclerotic glomeruli [mean (range)] | 7 (0–60) | 7 (0–28) | 25 (0–71) |
| <5% global sclerosis, n (%) | 44 (60) | 14 (47) | 11 (29) |
| 6–25% global sclerosis, n (%) | 25 (35) | 15 (50) | 12 (32) |
| 26–50% global sclerosis, n (%) | 3 (4) | 1 (3) | 11 (29) |
| 51–100% global sclerosis, n (%) | 1 (1) | 0 (0) | 4 (10) |
| Percent segmentally sclerotic glomeruli [mean (range)] | 0 (0) | 3.7 (1–8) | 3.2 (1–11) |
| Mesangial hypercellularity, focal and segmental, n (%) | 0 (0) | 0 (0) | 2 (5) |
| Tubular atrophy and interstitial fibrosis, % of cortex | |||
| <5%, n (%) | 11 (15) | 5 (16) | 0 (0) |
| 6–25%, n (%) | 61 (84) | 23 (77) | 25 (66) |
| 26–50%, n (%) | 1 (1) | 2 (7) | 10 (26) |
| 51–100%, n (%) | 0 (0) | 0 (0) | 3 (8) |
| Glomerular IF staining | |||
| IgM, segmental granular | |||
| 0 or trace | 59 (81) | 24 (80) | 26 (68) |
| Trace to 1+ | 13 (18) | 5 (17) | 11 (29) |
| 1+ or 1–2+ | 1 (1) | 1 (3) | 1 (3) |
| C1q, segmental granular, trace or trace −1+, n (%) | 4 (5) | 0 (0) | 2 (5) |
| Electron microscopic findings | |||
| Mesangial deposits, segmental, n (%) | 0 (0) | 2 (7) | 1 (3) |
| Foot process effacement, estimated, n (%) | |||
| <80% | 0 (0) | 2 (7) | 14 (37) |
| ≥80% | 73 (100) | 28 (93) | 24 (63) |
Direct IF was performed retrospectively on consecutively cut frozen sections from the 144 biopsies using fluorescein isothiocyanate-conjugated antibodies against human IgG and albumin (Aligent Technologies, Santa Clara, CA, USA). For each biopsy and stain, staining of cortical tPRD for IgG and albumin was graded on a 0–3+ scale taking into account the distribution and intensity of staining as follows: 0, no staining or staining in <10% of cortical tubules (Figure 1A); 1+, staining in 10–50% of cortical tubules with weak staining in the majority of involved tubules (Figure 1B); 2+, staining in 10–50% of cortical tubules with moderate staining in the majority of tubules (Figure 1C) or staining in >50% of tubules with weak staining in the majority of tubules; 3+, staining in >50% of cortical tubules with moderate-to-strong staining in the majority of tubules (Figure 1D) or staining in 10–50% of tubules with strong staining in the majority of tubules (Table 3). The first 45 cases were examined by two observers (L.B. and M.H.) and the grades of staining for IgG and albumin determined as the average of the grades assigned by each observer. The remaining 99 cases were graded by one observer (M.H.); in all cases, the observers were blinded to the diagnosis. For each biopsy, an IgG/albumin ratio was determined from grade of IgG staining/grade of albumin staining. These ratios were further divided into three groups: low (≤0.33), moderate (>0.33 and <1.0) and high (1.0). Inter-observer agreement was 67% (30/45) for both IgG and albumin grades, with no disagreement >1+, and the IgG/albumin ratio agreement was 78% (35/45). The extent of cortical interstitial fibrosis and tubular atrophy (IFTA) on the original renal biopsy slides was estimated using the Masson trichrome stained sections as minimal (<5%), mild (5–25%), moderate (26–50%) and severe (>50%) as shown in Table 2, and additional analysis of tPRD staining was performed in the group with mild IFTA. The severity of global glomerulosclerosis (GGS) was categorized as minimal, mild, moderate and severe using the same percentages as for IFTA, <5 and 5–25%, 26–50 and >50%, and additional analysis of tPRD staining was performed in the combined groups with minimal and mild GGS.
FIGURE 1.

Examples of grading of direct IF staining in tubular epithelial protein reabsorption droplets on frozen sections: 0 (A), 1+ (B), 2+ (C) and 3+ (D) based on a combination of distribution and intensity as described in Materials and methods section and Table 3. A representative case shows IgG/albumin staining ratio of 0, with 2+ albumin staining in tubular epithelial protein reabsorption droplets (E) and negative IgG staining (F) on consecutive sections at the same location. Fluorescein isothiocyante-conjugated anti-human IgG, original magnification of photomicrograph ×200 in (A–D) and ×400 in (E) and (F).
Table 3.
Grading of direct IF staining (0–3+)
| Grade | Distribution of positively stained tubules (%) | Intensity |
|---|---|---|
| 0 | <10 | Week to strong |
| 1+ | 10–50 | Weak |
| 2+ | 10–50 | Moderate |
| 2+ | >50 | Weak |
| 3+ | 10–50 | Strong |
| 3+ | >50 | Moderate to strong |
Statistical analysis
Results for numerical variables were reported as mean ± standard deviation (SD) or mean and range. Results for categorical variables were reported as frequency and percentage. Differences in numerical variables across diagnostic categories were assessed by analysis of variance (ANOVA) with contrasts. The discriminative ability of the IgG/albumin staining ratio to distinguish MCD from FSGS (all histologic variants) was presented in a receiver operating characteristic curve, with area under the curve (AUC) and its 95% confidence interval. The three FSGS collapsing cases were excluded from the ANOVA because of the small number of such cases (n = 3). Comparisons of the excluded FSGS cases with segmentally sclerotic glomeruli present on IF specimen (n = 31) versus FSGS cases included in the study (n = 71) were evaluated by Wilcoxon rank-sum test. A two-sided 0.05 significance level was used throughout. Statistical calculations were performed using SAS version 9.4 (SAS Institute, Cary, NC, USA).
RESULTS
MCD and FSGS have different IgG/albumin staining ratios in tPRD
Table 4 shows IgG and albumin staining ratios in tPRD in MCD, FSGS-tip, FSGS-NOS and FSGS collapsing. Of the 73 MCD cases, 41 (56%) showed a ratio of 0 (Figure 1E and F), 22 (30%) showed a ratio of 0.33, and only 1 (1%) had a ratio of 1.0 (Table 4). In contrast, of the 30 FSGS-tip cases, 14 (47%) had a ratio of ≤0.33 and 3 (10%) had a ratio of 1.0. Only 2 of 38 (5%) FSGS-NOS had a ratio of 0.5, 5 of 38 (13%) showed a ratio of 0.33, and 15 of 38 (39%) had a ratio of 1.0. The mean ratios were 0.186 ± 0.239 for MCD, 0.423 ± 0.334 for FSGS-tip (P = 0.0001 versus MCD) and 0.693 ± 0.297 for FSGS-NOS (P < 0.0001 versus MCD; P = 0.0001 versus FSGS-tip) (Table 5). All three FSGS collapsing cases showed a ratio of either 0.67 or 1.0. Due to small sample size for FSGS collapsing, these three cases were excluded for statistical analysis.
Table 4.
Summary of IgG/albumin staining ratios in tubular protein reabsorption droplets
| Ratio | MCD (n = 73) | FSGS-tip (n = 30) | FSGS-NOS (n = 38) | FSGS collapsing (n = 3) |
|---|---|---|---|---|
| 0 | 41 (56) | 9 (30) | 2 (5) | 0 (0) |
| 0.33 | 22 (30) | 5 (17) | 5 (13) | 0 (0) |
| 0.5 | 4 (5) | 4 (13) | 6 (16) | 0 (0) |
| 0.67 | 5 (7) | 9 (30) | 10 (26) | 1 (33) |
| 1.0 | 1 (1) | 3 (10) | 15 (39) | 2 (67) |
Table 5.
IgG/albumin in tubular protein reabsorption droplets in MCD, FSGS-tip and FSGS-NOS
| Diagnosis | n | Mean (SD) | P-value | P-value |
|---|---|---|---|---|
| MCD | 73 | 0.186 (0.239) | ||
| FSGS-tip | 30 | 0.423 (0.334) | 0.0001a | |
| FSGS-NOS | 38 | 0.693 (0.297) | <0.0001a | 0.0001b |
| MCD ‘with mild IFTA (6–25%)’ | 61 | 0.193 (0.240) | ||
| FSGS-tip ‘with mild IFTA (6–25%)’ | 23 | 0.377 (0.350) | 0.0067a | |
| FSGS-NOS ‘with mild IFTA (6–25%)’ | 25 | 0.714 (0.267) | <0.0001a | <0.0001b |
| MCD ‘with 0–25% GGS’ | 69 | 0.173 (0.214) | ||
| FSGS-tip ‘with 0–25% GGS’ | 29 | 0.437 (0.330) | <0.0001a | |
| FSGS-NOS ‘with 0–25% GGS’ | 23 | 0.703 (0.293) | <0.0001a | 0.0004b |
Versus MCD.
Versus FSGS-tip.
IgG/albumin staining in tPRD in renal biopsies of MCD and FSGS with matched tubulointerstitial scarring and GGS
To further evaluate whether the observed differences in tPRD IgG/albumin ratio were confounded by the extent of IFTA, the latter was semi-quantified and grouped into minimal, mild, moderate and severe (see Materials and methods section). As shown in Table 2, of the 73 MCD biopsies, 11 (15%) had minimal IFTA, 61 (84%) showed mild IFTA and only 1 (1%) had moderate IFTA. Similar degrees of IFTA were observed in FSGS-tip, with 5/30 (16%) cases having minimal IFTA and 23/30 (77%) mild IFTA. In contrast, FSGS-NOS cases showed more prominent tubulointerstitial scarring, with mild IFTA in 25/38 (66%), moderate IFTA in 10/38 (26%) and severe IFTA in 3/38 (8%); none had minimal IFTA.
Since the majority of cases (109/141) had mild tubulointerstitial scarring across all three groups and only three cases showed moderate-to-severe scarring in MCD (n = 1) and FSGS-tip (n = 2), IgG/albumin ratios in tPRD were compared in those biopsies with mild IFTA. Notably, the mean values for IgG/albumin ratio in these cases were similar to those in the full cohort, with significant differences observed in paired comparisons among MCD, FSGS-tip and FSGS-NOS (Table 5).
We also examined if our data were affected by the extent of GGS. As expected, moderate-or-severe GGS (see Materials and methods section) was observed in 15/38 cases of FSGS-NOS compared with 4/73 MCD and 1/30 FSGS-tip, respectively. Due to the paucity of cases with moderate-to-severe GGS in MCD and FSGS-tip, additional statistical analysis was performed only for the subgroup of cases with minimal or mild (0–25%) GGS. For this latter group, we observed very similar results to those in the full cohort for mean tPRD IgG/albumin staining ratios in MCD, FSGS-tip and FSGS-NOS (Table 5).
Furthermore, we reexamined whether a sampling bias might have been introduced by excluding the 31 FSGS cases with segmentally sclerotic glomeruli present on IF specimen. These cases included FSGS-tip (n = 9), FSGS-NOS (n = 19) and FSGS collapsing (n = 3). No difference in IgG/albumin staining ratios between the excluded cases and cases of FSGS included in the study was observed when considering only FSGS-tip, only FSGS-NOS, only collapsing FSGS or all FSGS variants combined (Table 6). Additionally, there was no difference between the excluded cases and FSGS cases included in the study with respect to the total number of glomeruli per biopsy or the percentage of globally sclerotic glomeruli, although the excluded cases did have a significantly higher percentage of segmentally sclerotic glomeruli (Table 7). However, the latter is not unexpected as the reason that these cases were excluded was the presence of segmental sclerosis lesion(s) on the IF specimen, which could introduce potential bias into the readings for IgG and albumin in tPRD. However, as there was no difference in tPRD IgG/albumin staining ratios between the excluded cases and FSGS cases included in the study, it is unlikely that exclusion of the 31 cases with FSGS lesions on the IF sample impacted the study findings and conclusions.
Table 6.
Comparison of IgG/albumin ratios in tubular protein reabsorption droplets in the excluded cases (n = 31) versus FSGS cases included in the study (n = 71)
| Groups | n | Mean (SD) | P-valuea |
|---|---|---|---|
| FSGS-tip | |||
| Excluded | 9 | 0.44 (0.32) | |
| Study cases | 30 | 0.42 (0.33) | 0.94 |
| FSGS-NOS | |||
| Excluded | 19 | 0.62 (0.27) | |
| Study cases | 38 | 0.69 (0.30) | 0.29 |
| FSGS collapsing | |||
| Excluded | 3 | 0.83 (0.29) | |
| Study cases | 3 | 0.89 (0.19) | >0.99 |
| All FSGS variants | |||
| Excluded | 31 | 0.59 (0.30) | |
| Study cases | 71 | 0.59 (0.34) | 0.82 |
By Wilcoxon rank-sum test.
Table 7.
Comparison of total number of glomeruli, percent globally sclerotic glomeruli and percent segmentally sclerotic glomeruli in the excluded cases (n = 31) versus FSGS cases included in the study (n = 71)
| Groups | N | Mean (SD) | P-valueb |
|---|---|---|---|
| Total number of glomerulia | |||
| Excluded | 31 | 37.5 (19.1) | |
| Study cases | 71 | 34.5 (16.6) | 0.51 |
| Percent globally sclerotic glomeruli | |||
| Excluded | 31 | 18.5 (17.6) | |
| Study cases | 71 | 15.4 (18.8) | 0.24 |
| Percent segmentally sclerotic glomeruli | |||
| Excluded | 31 | 18.1 (10.3) | |
| Study cases | 71 | 13.4 (8.8) | 0.025 |
Sum of number of glomeruli in light microscopy, IF and electron microscopy specimens.
By Wilcoxon rank sum test.
IgG/albumin staining ratio in tPRD might be useful to distinguish between MCD and FSGS
We next examined whether the ratio of IgG/albumin staining in tPRD could be used as a marker to distinguish between MCD and FSGS. The ratios were divided into three groups: low, moderate and high (≤0.33, >0.33 and <1.0, and 1.0, respectively) (Figure 2). Of the 84 biopsies with a low IgG/albumin, 63 (75%) showed MCD, 14 (17%) FSGS-tip and only 7 (8%) FSGS-NOS. In contrast, among the 19 cases with a high ratio, all but one showed FSGS, including 15 (79%) FSGS-NOS. When the ratio of IgG/albumin was low, the positive predictive value for a diagnosis of MCD was 90%; and when the ratio of IgG/albumin was high, the negative predictive value for a diagnosis of MCD was 76%. On the other hand, when the ratio of IgG/albumin was high, the positive predictive value for a diagnosis of FSGS-NOS was 76%; when the ratio of IgG/albumin was low, the negative predictive value for diagnosis of FSGS-NOS was 90%. Thus IgG/albumin in tPRD might be helpful to distinguish between MCD and FSGS-NOS.
FIGURE 2.
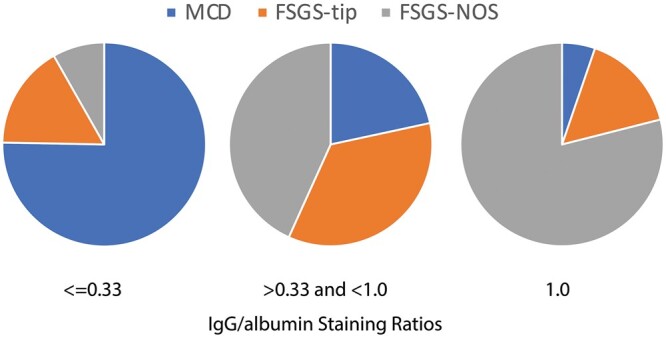
Pie chart distribution of the IgG/albumin staining ratio in tubular epithelial protein reabsorption droplets in renal biopsies from patients with NS and a diagnosis of MCD or FSGS. Due to small sample size for FSGS collapsing (n = 3), these cases were excluded for further statistical analysis.
For all 144 cases (73 MCD, 71 FSGS), the IgG/albumin ratio significantly discriminated between MCD and FSGS with a C-statistic (AUC in Figure 3) of 0.819.
FIGURE 3.
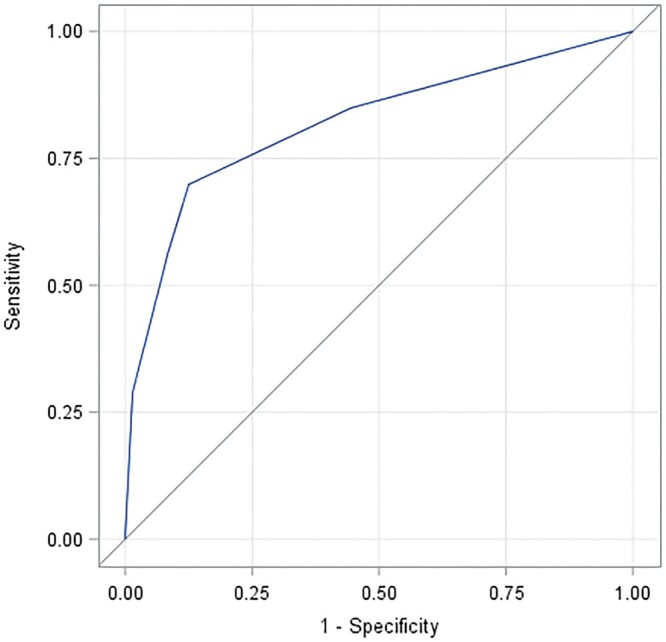
Receiver operating characteristic curve of sensitivity (true-positive rate) versus false-positive rate (1 – specificity) for the ability of the IgG /albumin staining ratio in tubular epithelial protein reabsorption droplets to distinguish MCD from FSGS (all histologic variants) in the entire cohort of 144 patients. From the Mann–Whitney test, the AUC (C-statistic; discrimination index) is 0.819 with Wald 95% confidence limits 0.751–0.886. AUC was not significantly different using ratios determined as the average value of two investigators (L.B. and M.H.) for 45 cases and by a single investigator (M.H.) for the remaining 99 cases (line shown), and using ratios determined only by the latter investigator for all 144 cases.
DISCUSSION
The purpose of our study was to investigate whether the ratio of IgG/albumin staining in tPRD was different in renal biopsies with MCD versus FSGS, and to evaluate the potential value of this ratio to distinguish between these two lesions. Our study design is based on the assumption that tubular reabsorption of protein is nonselective, as in an early study of selectivity of proteinuria [7]. With this assumption, renal biopsies from MCD patients with selective proteinuria (albuminuria) would show predominantly albumin and much less IgG staining in tPRD, whereas renal biopsies with less selective proteinuria would show higher ratios of IgG/albumin in tPRD. Our study of 144 patients with nephrotic-range proteinuria and biopsy-proven MCD and FSGS (mainly FSGS-tip and FSGS-NOS) demonstrated that low IgG/albumin staining in tPRD is associated with MCD, whereas high IgG/albumin is correlated with FSGS-NOS; each of the three biopsies with FSGS collapsing also showed high ratios.
Prior studies on the correlation between the selectivity of proteinuria and histology on renal biopsy investigated both primary and secondary glomerular diseases, including MCD, membranous nephropathy (MN), FSGS, different forms of proliferative glomerulonephritis, Alport syndrome, crescentic glomerulonephritis, immunoglobulin A vasculitis, lupus nephritis, amyloidosis, diabetic nephropathy and drug-induced glomerular lesions [6, 9, 11–13]. It is well-established that MCD is correlated with highly selective proteinuria, and this is consistent with our findings that MCD is associated with low IgG/albumin in tPRD. The correlation between FSGS and higher IgG/albumin in tPRD is also compatible with previously published data, albeit limited [11, 13].
There may be a relationship between chronic lesions (GGS and tubulointerstitial scarring) and nonselective proteinuria. In the study of Bazzi et al. [13], which grouped patients with NS into those with nonselective proteinuria (n = 40; 21 MN, 18 FSGS and 1 MCD) and selective proteinuria (n = 15; 7 MN, 2 FSGS and 6 MCD), 72% of patients with nonselective proteinuria had moderate or severe tubulointerstitial damage compared with only 15% of those with selective proteinuria. We feel that this result most likely reflects a predominance of patients with FSGS and MN among those with moderate or severe tubulointerstitial damage rather than a direct association between such damage and selectivity of proteinuria. While in our study, 15 of 16 biopsies with moderate-to-severe IFTA showed FSGS, IgG/albumin staining ratios in tPRD in FSGS patients were similar in those with only mild IFTA and in the entire FSGS cohort, and were similarly higher than ratios in MCD patients in both the entire patient cohort and those with only mild IFTA.
Similarly, MCD and FSGS cases with only minimal or mild GGS showed similar findings of low IgG/albumin ratio in MCD, intermediate IgG/albumin ratio in FSGS-tip and higher IgG/albumin in FSGS-NOS as observed in the full patient cohort. Although the limited number of MCD cases with moderate-to-severe chronic lesions does not allow for evaluation of the relationship between IgG/albumin ratio in tPRD and disease progression (IFTA and GGS), our findings suggest that the IgG/albumin ratio is primarily a function of the primary glomerular disease present.
Interestingly, the clinical prognostic value of selective proteinuria has been reported in other glomerular disorders including MN [14] and lupus nephritis [15], although the latter studies dealt with the predictive value of the SI for the treatment response and renal functional outcome. The presence of highly selective and poorly selective proteinuria in different manifestations of the same underlying disease process may suggest the coexistence of potentially reversible and nonreversible changes in glomerular filtration barrier, although the mechanisms are still yet to be elucidated.
There are several limitations of this study. We do not have data on response of proteinuria to therapy or other outcomes, such as relapses and renal functional decline. While our findings strongly suggest that the main factor affecting the IgG/albumin ratio in tPRD is selectivity of proteinuria, we did not actually measure this selectivity or the respective concentrations of albumin and IgG in urine samples. Furthermore, the pathophysiology of the formation of tubular epithelial protein reabsorption droplets and factors affecting this in patients with NS is still uncertain. Still, our findings suggest that extremes of the IgG/albumin ratio in tPRD may be helpful in distinguishing MCD from FSGS (particularly FSGS-NOS) in patients with NS and renal biopsies that are inadequate to distinguish between these possibilities but in which MN can be ruled out by routine IF or electron microscopy. This may be potentially useful in reducing the need for repeat biopsies in such patients. Future investigation testing whether IF studies of outer medullary samples without glomeruli show similar differences in tPRD IgG/albumin staining ratio in MCD versus FSGS to those observed in our cortical samples may also be helpful in this regard.
CONCLUSIONS
We demonstrate a significant relationship between the IgG/albumin staining ratio in tPRD and renal biopsy histology in patients with NS and a diagnosis of either MCD or FSGS. A low (≤0.33) IgG/albumin ratio is highly associated with MCD, while the probability of MCD diminishes as the ratio increases, and MCD is unlikely when the ratio is 1.0. In contrast, a high IgG/albumin ratio is associated with a high probability of FSGS (especially FSGS-NOS and possibly FSGS collapsing). We conclude that the IgG/albumin staining ratio in tPRD can potentially be used to distinguish between MCD and FSGS, such as in biopsies with inadequate glomerular sampling or cases of early FSGS, although additional studies directly testing such cases are needed.
ACKNOWLEDGEMENTS
Portions of this study were presented at the 108th Annual Meeting of the US and Canadian Academy of Pathology (March 2019) and published in abstract form #1586. J.M. was supported by National Center for Advancing Translational Sciences Grant UL1TR001881.
CONFLICT OF INTEREST STATEMENT
M.H. serves as a paid consultant on pathology adjudication committees for two industry-sponsored clinical trials (Shire ViroPharma, Treatment of Acute Antibody-Mediated Rejection; AstraZeneca, Treatment of Proliferative Lupus Nephritis). He has also received honoraria from CareDx for serving as a symposium speaker and consultant, and from Novartis for serving as a consultant. None represent a conflict of interest relevant to any of the material presented in this manuscript.
REFERENCES
- 1. Deen WM, Bridges CR, Brenner BM. et al. Heteroporous model of glomerular size selectivity: application to normal and nephrotic humans. Am J Physiol 1985; 249: F374–F389 [DOI] [PubMed] [Google Scholar]
- 2. Kitano Y, Yoshikawa N, Nakamur H.. Glomerular anionic sites in minimal change nephrotic syndrome and focal segmental glomerulosclerosis. Clin Nephrol 1993; 40: 199–204 [PubMed] [Google Scholar]
- 3. Cui S, Verroust PJ, Moestrup SK. et al. Megalin/gp330 mediates uptake of albumin in renal proximal tubule. Am J Physiol 1996; 271: F900–F907 [DOI] [PubMed] [Google Scholar]
- 4. Amsellem S, Gburek J, Hamard G . et al. Cubilin is essential for albumin reabsorption in the renal proximal tubule. J Am Soc Nephrol 2010; 21: 1859–1867 [DOI] [PMC free article] [PubMed] [Google Scholar]
- 5. Tencer J, Torffvit O, Thysell H. et al. Proteinuria selectivity index based upon alpha 2-macroglobulin or IgM is superior to the IgG based index in differentiating glomerular diseases. Technical note. Kidney Int 1998; 54: 2098–2105 [DOI] [PubMed] [Google Scholar]
- 6. Blainey JD, Brewer DB, Hardwicke J. et al. The nephrotic syndrome. Diagnosis by renal biopsy and biochemical and immunological analyses related to the response to steroid therapy. Q J Med 1960; 29: 235–256 [PubMed] [Google Scholar]
- 7. Joachim GR, Cameron JS, Schwartz M. et al. Selectivity of protein excretion in patients with the nephrotic syndrome. J Clin Invest 1964; 43: 2332–2346 [DOI] [PMC free article] [PubMed] [Google Scholar]
- 8. Cameron JS, White RH.. Selectivity of proteinuria in children with the nephrotic syndrome. Lancet 1965; 1: 463–465 [DOI] [PubMed] [Google Scholar]
- 9. Cameron JS. Histology, protein clearances, and response to treatment in the nephrotic syndrome. Br Med J 1968; 4: 352–356 [DOI] [PMC free article] [PubMed] [Google Scholar]
- 10. Deegens JK, Wetzels JF.. Fractional excretion of high- and low-molecular weight proteins and outcome in primary focal segmental glomerulosclerosis. Clin Nephrol 2007; 68: 201–208 [DOI] [PubMed] [Google Scholar]
- 11. Laurent J, Philippon C, Lagrue G. et al. Proteinuria selectivity index–prognostic value in lipoid nephrosis and related diseases. Nephron 1993; 65: 185–189 [DOI] [PubMed] [Google Scholar]
- 12. Tencer J, Bakoush O, Torffvit O.. Diagnostic and prognostic significance of proteinuria selectivity index in glomerular diseases. Clin Chim Acta 2000; 297: 73–83 [DOI] [PubMed] [Google Scholar]
- 13. Bazzi C, Petrini C, Rizza V. et al. A modern approach to selectivity of proteinuria and tubulointerstitial damage in nephrotic syndrome. Kidney Int 2000; 58: 1732–1741 [DOI] [PubMed] [Google Scholar]
- 14. Mallick NP, Short CD, Manos J.. Clinical membranous nephropathy. Nephron 1983; 34: 209–219 [DOI] [PubMed] [Google Scholar]
- 15. Hasegawa T, Suzuki K, Kaneko Y. et al. Proteinuria selectivity index as a prognostic biomarker in lupus nephritis. Lupus 2017; 26: 656–660 [DOI] [PubMed] [Google Scholar]