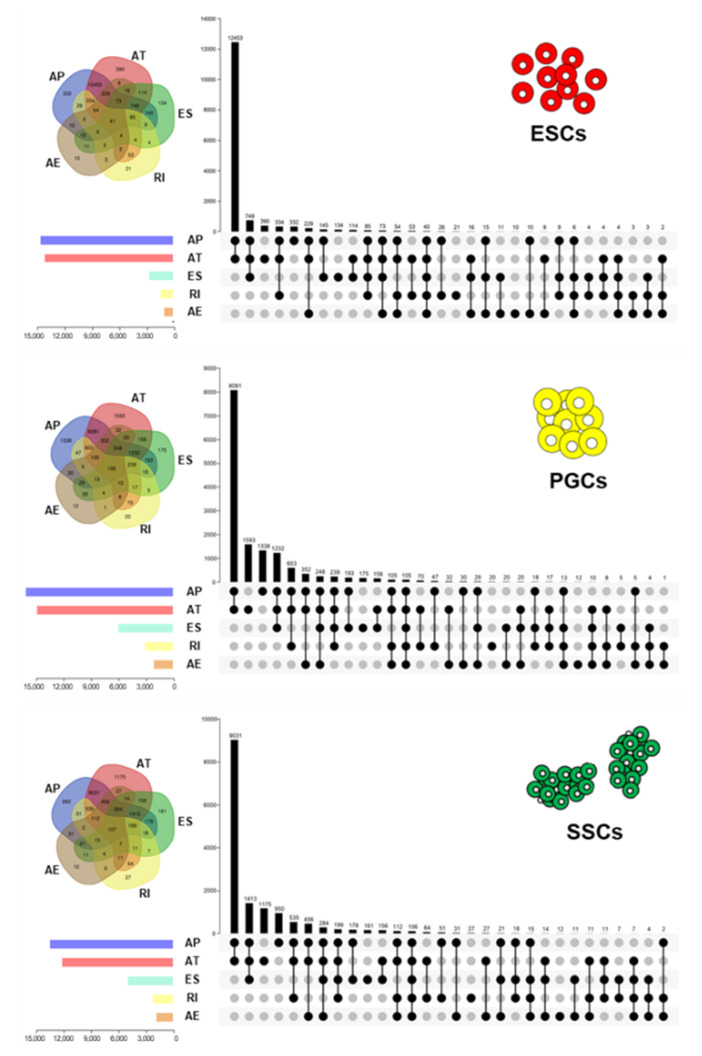
Figure 2.
Distribution analysis of AS events during male chicken germ cell differentiation. The Veen and Upset plots show the distribution of AS events in chicken ESCs, gPGCs, and SSCs. The bar chart above represents the number of genes contained in each type of group. The bar chart at the bottom-left represents the number of events included in each type of AS event. The dotted line at the bottom-right shows the types of events contained in the group.

