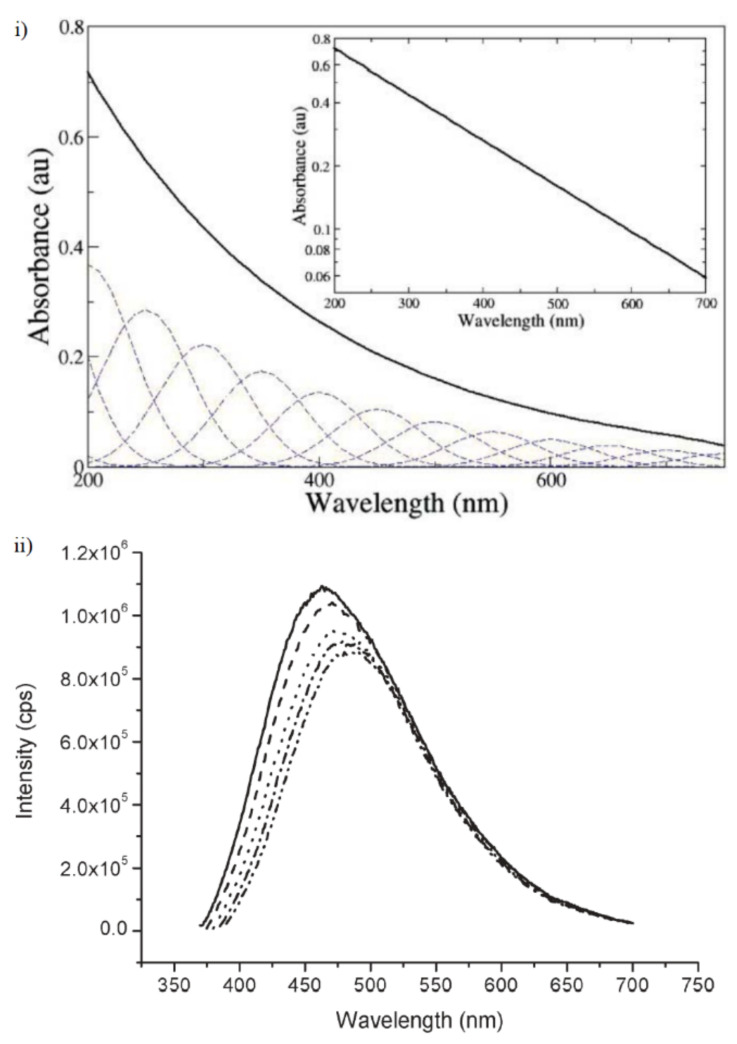
Figure 7.
(i) An example of melanin’s UV-Vis absorbance spectrum. A log-linear plot of the data is depicted in the inset, demonstrating its exponential behavior. (ii) An example of the fluorescence emission spectra of melanin. The various dotted lines indicate the spectra obtained with variation of the laser pump energy (360 nm—solid line, to 380 nm—inner dot–dash line, in 5 nm intervals). Figures adapted from Ref. [69] with permission from The Royal Society of Chemistry.

