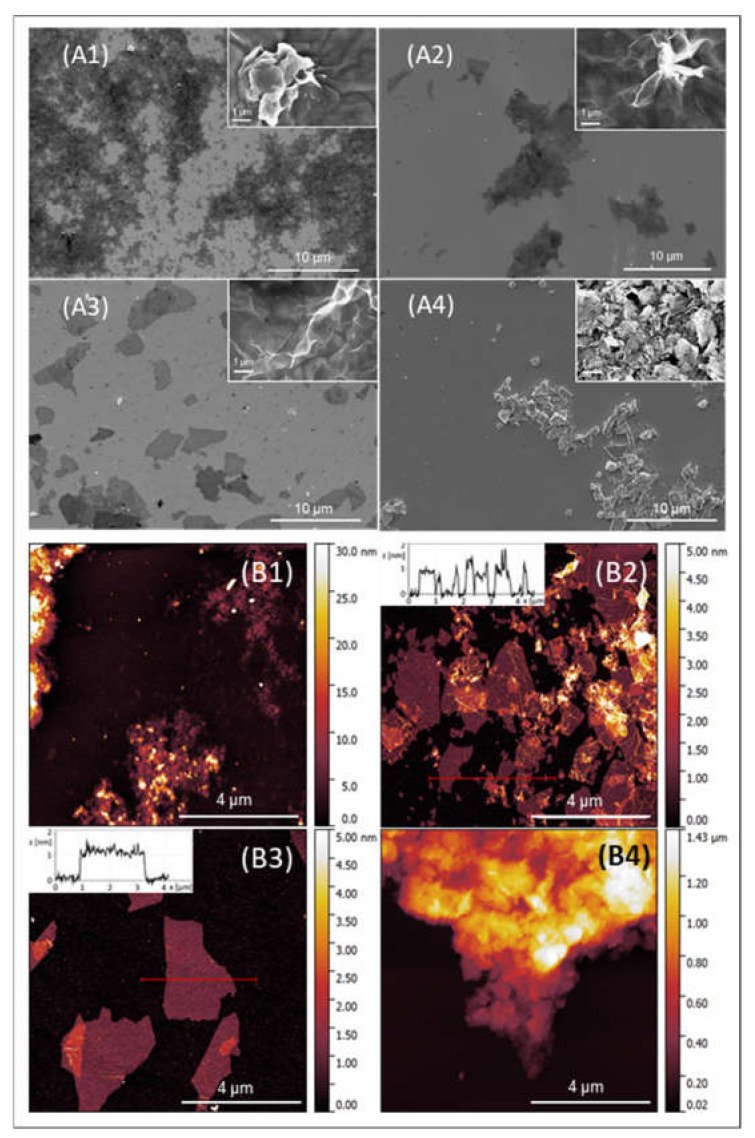
Figure 1.
Microscopic analysis of tested GO samples. (A) SEM analysis: S1 (A1), S2 (A2), S3 (A3), and S4 (A4). Scale bars are 10 µm in leading images and 1 µm nm in the inset of the image. (B) AFM images: S1 (B1), S2 (B2), S3 (B3), and S4 (B4). Scale bars are 4 µm in leading images. An inset on (B2) and (B3) shows a cross-section through graphene oxide flakes at the marked region.

