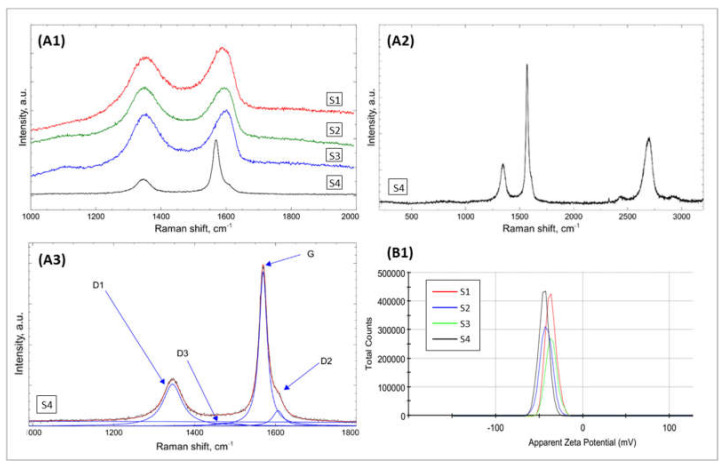
Figure 3.
Spectroscopic analysis of GO samples. Comparison of the first-order Raman spectra of the S1–S4 samples (A1), first and second-order spectrum of the S4 sample (A2), and first-order Raman spectra of the S1 sample. The solid line shows the best fit of the sum (red) of four components (G, D1, D2, D3) to the experimental results (black) (A3). Electrokinetic potential (ζ potential) of the tested GO samples (B1).

