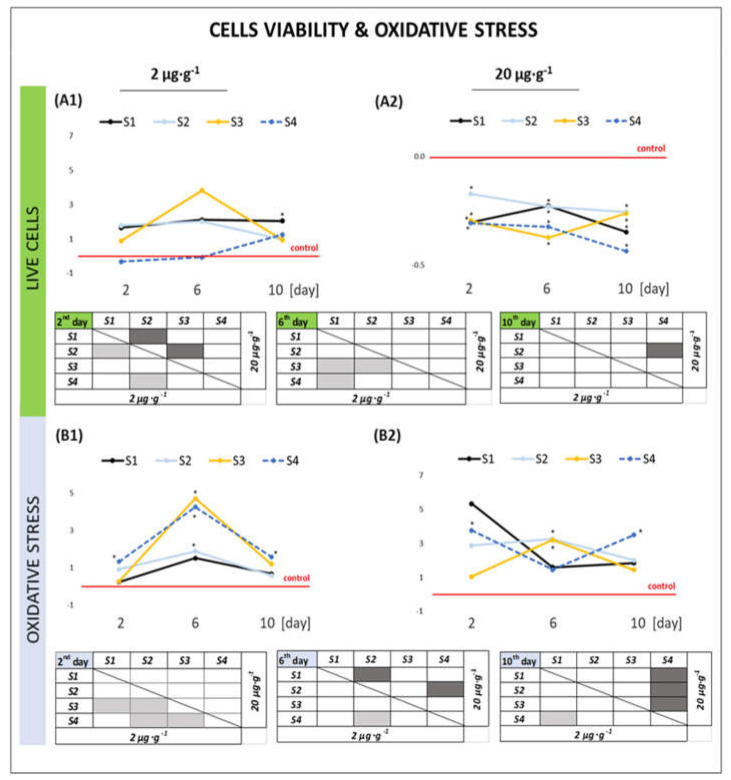
Figure 5.
Cell viability (A1,A2) and the level of oxidative stress (B1,B2) in gut cells of A. domesticus after 2, 6, and 10 days of exposure to various suspensions of GO nanoparticles in food (concentrations: 2 μg·g−1 of food and 20 μg·g−1 of food in comparison to the control level (red line). Explanation: The control group results were normalized to 1 in each respective time point. Averages of each experimental group were calculated concerning these normalized values. The tables below the graphs show the statistical differences between tested GO suspensions (S1–S4) for each time point and concentration. Groups that differ statistically from each other are marked in gray (HSD Tukey test, ANOVA; p < 0.05).

