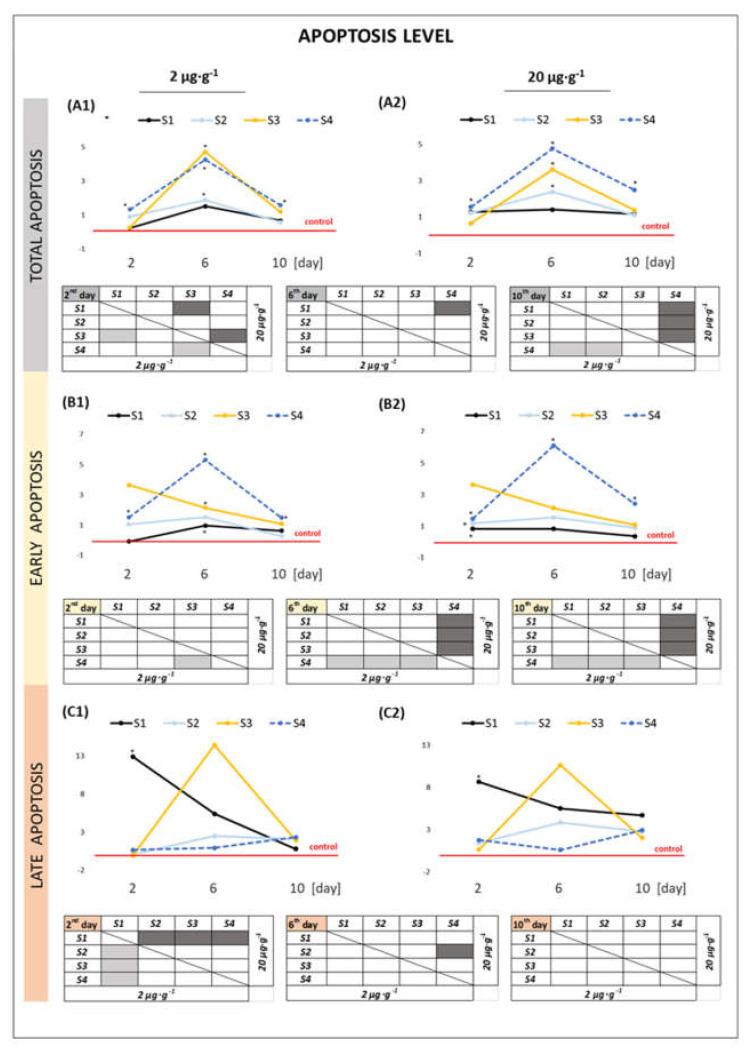
Figure 6.
Total apoptosis (A1,A2), early apoptosis (B1,B2), and late apoptosis level (C1,C2) in gut cells of A. domesticus during 10 days of exposure to various suspensions of GO nanoparticles in food (concentrations: 2 μg·g−1 of food and 20 μg·g−1 of food in comparison to the control level (red line). Explanation of the chart as in Figure 5.

