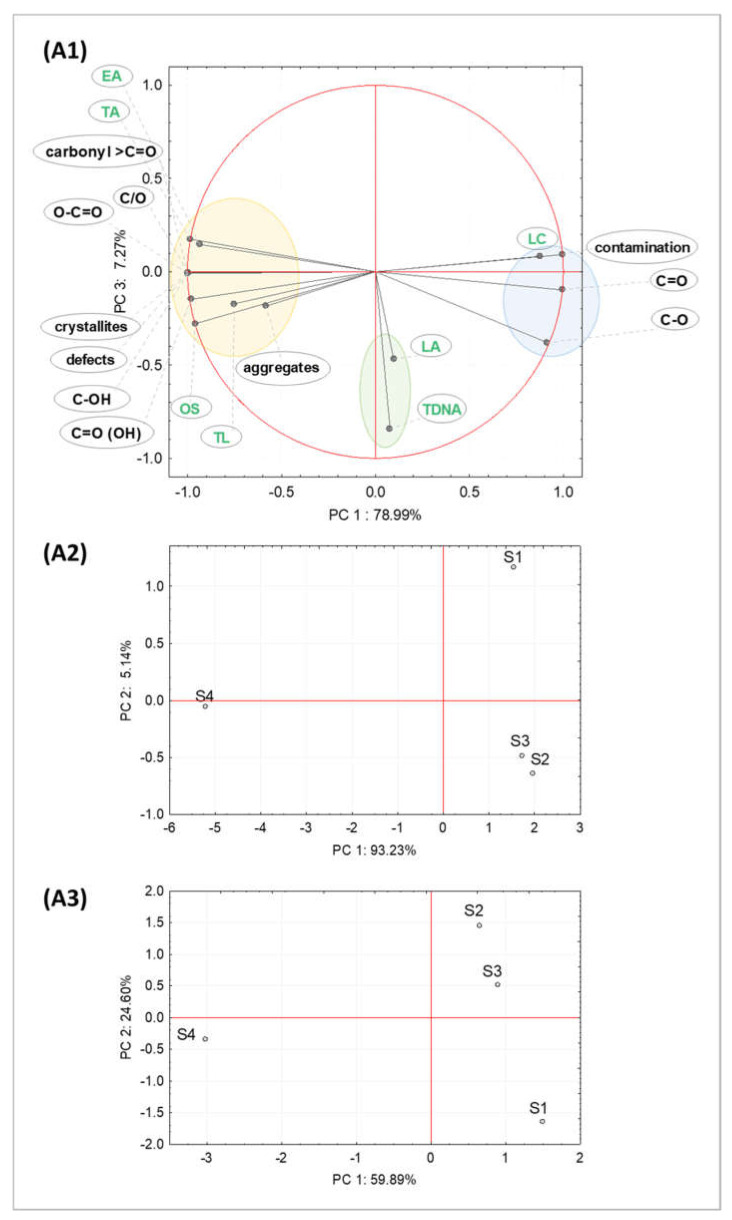
Figure 9.
Principal component analysis (PCA) presenting similarities among the biomarkers measured (20 μg·g−1, 10th day of the experiment) and GO physicochemical parameters. (A1) The PCA plot identifying three markedly different clusters; (A2) 2D plot for all biomarkers measured after exposure to various GO (S1-S4) samples; (A3) 2D plot for all physicochemical parameters of S1-S4 samples. Abbreviations: EA—early apoptosis, TA—total apoptosis, LA—late apoptosis, OS—oxidative stress, TDNA and TL—DNA damage parameters, LC—live cells, S1–S4—tested GO samples.

