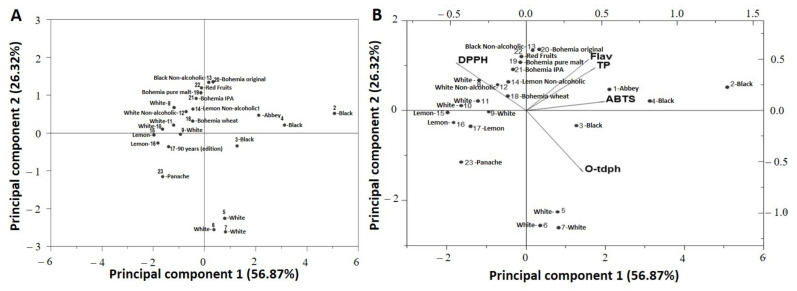
Figure 1.
(A) Simple dispersion graph (Principal component 1 × Principal component 2) over the main sources of beer variability; (B) Projection of the values obtained for PCs 1 and 2 for the different samples. The weights of each variable for each of the factors are represented by the position of the abbreviations in the quadrants.

