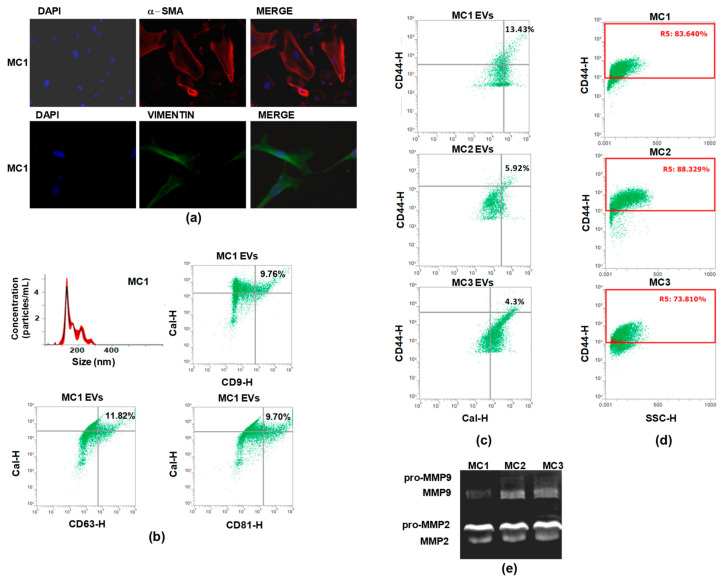
Figure 1.
Characterization of mesothelial cells and of the EVs secreted in the conditioned medium (CM). (a) Representative picture showing IF evaluation of the basal expression of α-SMA (red) and vimentin (green) in MC1, MC2, and MC3. Nuclei are counterstained with Dapi (blue) (magnification ×100). (b) Nanoparticle tracking analyses showing the concentration and the size of EVs released by MC1. FCM dot plots showing the percentage of Cal+/CD9+, Cal+/CD63+, Cal+/CD81+ EVs populations released by MC1. (c) FCM dot plots showing the percentage of CD44+/Cal+ EVs released by MC1, MC2, and MC3. (d) Dot plots indicating the percentage of CD44 expression in MC1, MC2, and MC3. (e) Representative gelatin zymography showing that MC1, MC2, and MC3 secreted both pro-MMP-2/MMP-9 and active MMP-2/MMP-9.

