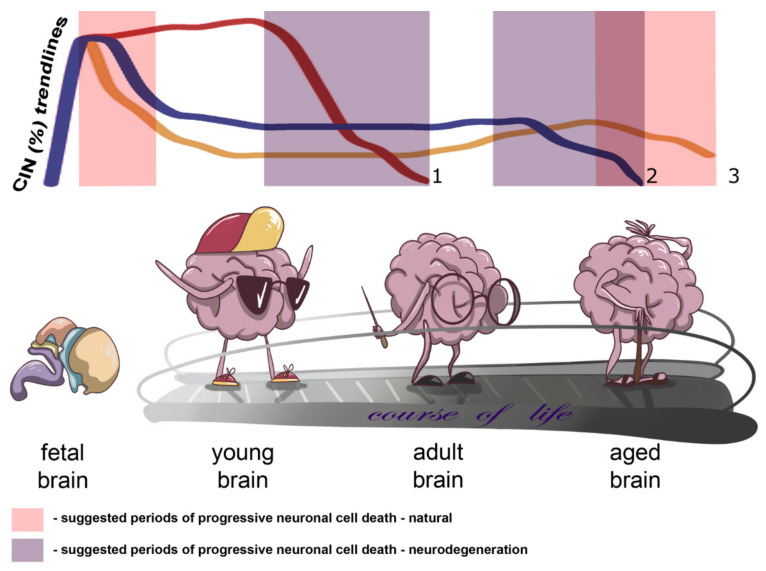
Figure 1.
Schematic depiction of changes in chromosome instability CIN rates in the context of brain aging and neurodegeneration indicating trends of brain-specific CIN rates through ontogeny and/or the course of life and suggested periods of progressive neuronal cell death in health and disease (natural and neurodegeneration, respectively): 1 or reddish trendline—CIN trend for early onset neurodegenerative diseases with accelerated aging phenotypes, e.g., ataxia-telangiectasia; 2 or blueish trendline—CIN trend for late onset neurodegenerative diseases; 3 or yellowish trendline—natural CIN trend.

