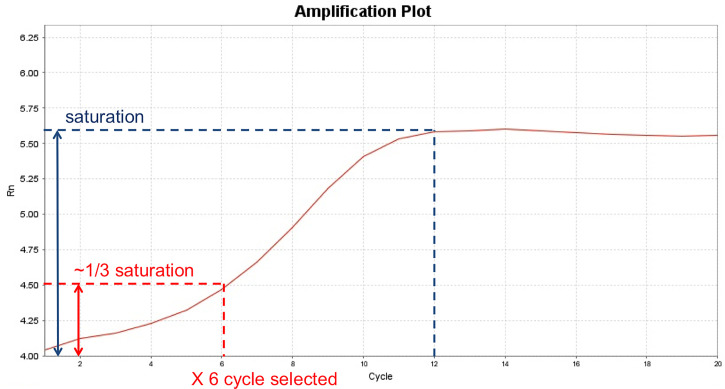
Figure 2. Example of optimizing ATAC-seq PCR cycle number by a qPCR method.
Shown here is an example of using qPCR to determine the optimal number of PCR cycles for ATAC-seq library preparation in C4-2 cells. A separate ATAC reaction with the same number of starting materials was set up in parallel to the actual ATAC-seq reaction, and finished Step A2. The qPCR reaction was set up similar to Step A3a, with the addition of 1:400 dilution of SybrGold Dye (Invitrogen S11494), and set up in a qPCR-compatible plate. The qPCR program was set up the same as Step A3b with real-time fluorescence reading for a total of 20 cycles. Upon finishing qPCR, the Rn (normalized reporter) value is plotted against the cycle number and the saturation point (indicated by the dashed blue line) is determined from the plot. From the Rn-Cycle plot, the cycle number is selected when it reaches 1/3 of the saturation signal (indicated by the red dashed line). In this particular example, a PCR cycle number of 6 was selected. If a separate ATAC reaction is not intended, a small portion (for example, 1/16) of the reaction after Step A2 can be used as input for the qPCR reaction; and the remaining reaction can be used for the final PCR amplification.

