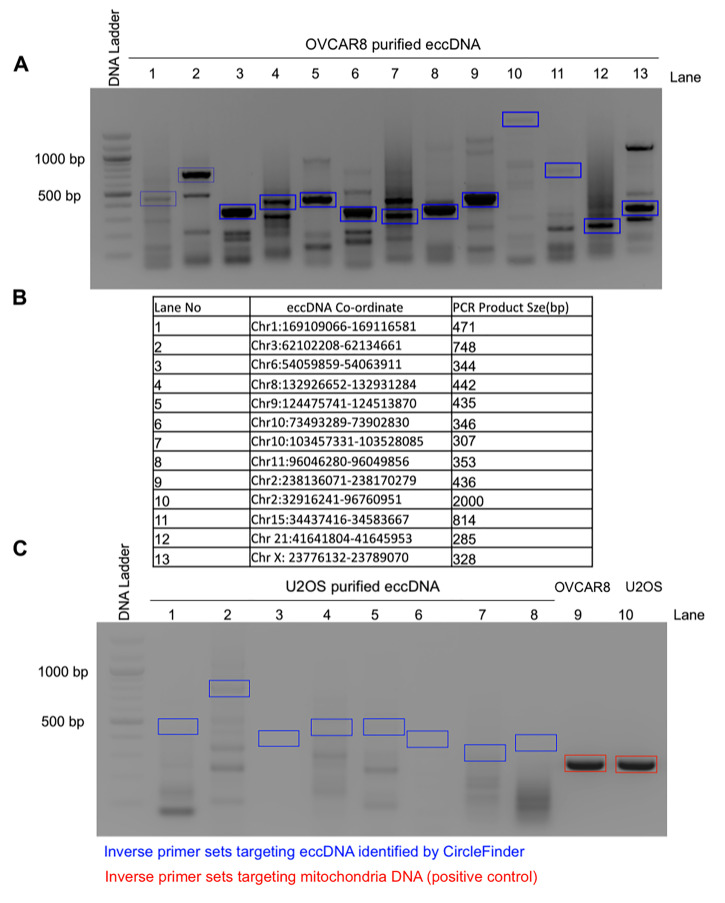
Figure 4. Representative eccDNA identified from the ATAC-seq library and validated by inverse PCR in OVCAR8 cells.
A. EccDNAs were amplified using inverse PCR primers (shown in blue boxes), gel purified, and validated for the presence of junctional sequences by Sanger sequencing. Example Sanger sequencing results can be found in Figure 3D of the original manuscript ( Kumar et al., 2020 ). B. The table represents the distribution of eccDNA on different chromosomes with coordinates and their expected PCR product size; the numbers represent the different lanes on the gel. C. As a negative control, the same inverse PCR primers were used on purified eccDNAs from U2OS cells (lanes 1-8). As a positive control, inverse PCR primers against mitochondrial DNA were used on eccDNAs (lanes 9-10).

