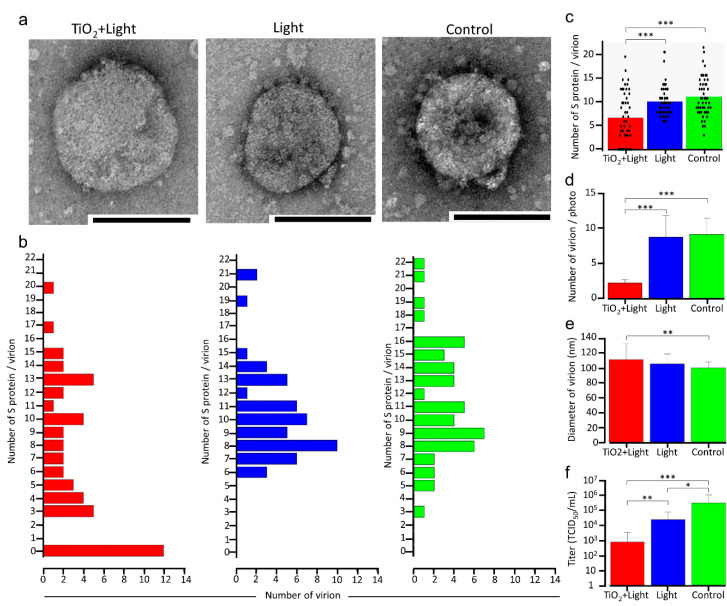
Figure 2.
Changes in SARS-CoV-2 virion morphology due to LED-TiO2 photocatalytic reaction. (a) SARS-CoV-2 (1 mL) titer of 1.78 × 10⁶ TCID50/mL was placed on TiO2-coated sheet and subjected to photocatalytic reaction for 120 min before TEM imaging. Representative virion images in the TiO2 + Light, Light, and control groups are shown. Bar = 100 nm. (b) Number of S proteins on single virions in individual TEM images of the TiO2 + Light, Light, and control groups was counted, and distribution and mean number of S protein/virion are shown. n = 50/group. (c) Each dot represents a value of S protein of each virion in (b). (d) Virion number in an area of 170 μm2 in an individual TEM image is shown, n = 10. (e) Diameter of single virion in an individual TEM image is shown. n = 40. (f) Viral titer in each group was confirmed by TCID50 assay. Each column and error bar represents the mean ± SD of results. All values were analyzed by two-way ANOVA followed by Tukey’s test. Asterisk indicates a statistically significant difference (* p < 0.05; ** p < 0.01; *** p < 0.001).

