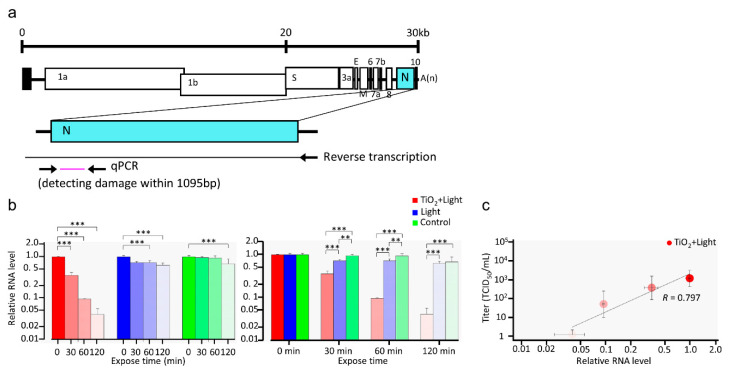
Figure 4.
Damage to SARS-CoV-2 RNA by LED-TiO2 photocatalytic reaction. (a) Schematic diagram of RT-qPCR primer-binding sites. (b) SARS-CoV-2 (1 mL) titer of 1.0 × 10⁵ TCID50/mL was placed on the TiO2-coated sheet and subjected to photocatalytic reaction for 0, 30, 60, and 120 min, and then viral RNA was extracted and measured by RT-qPCR. The relative RNA level compared to that in samples obtained at 0 min after LED light irradiation was calculated. All values in each group were compared with the 0 min sample by two-way ANOVA with Dunnett’s test (left panel). All values at each time point were analyzed by two-way ANOVA followed by Tukey’s test (right panel). (c) Linear regression analysis between SARS-CoV-2 infectivity (Figure 1) and RNA level. Each column and error bar represent the mean ± SD of results for two experiments. Asterisk indicates a statistically significant difference (** p < 0.01; *** p < 0.001). R indicates the Pearson correlation coefficient.

