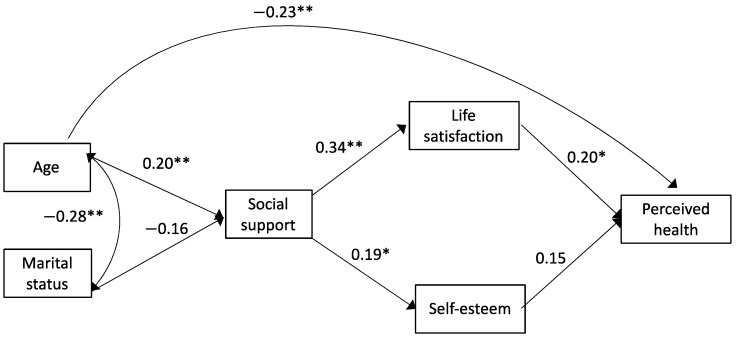
Figure 1.
Path analysis to explain perceived general health. Note: Errors are not displayed to improve the visibility of the model. The estimates of the parameters (standardized beta coefficient for regression analyzes, indicated with one-way arrows; and Pearson’s coefficient for correlation, indicated with a two-way arrow) that were statistically significant are indicated: * p ≤ 0.05; ** p ≤ 0.01.

