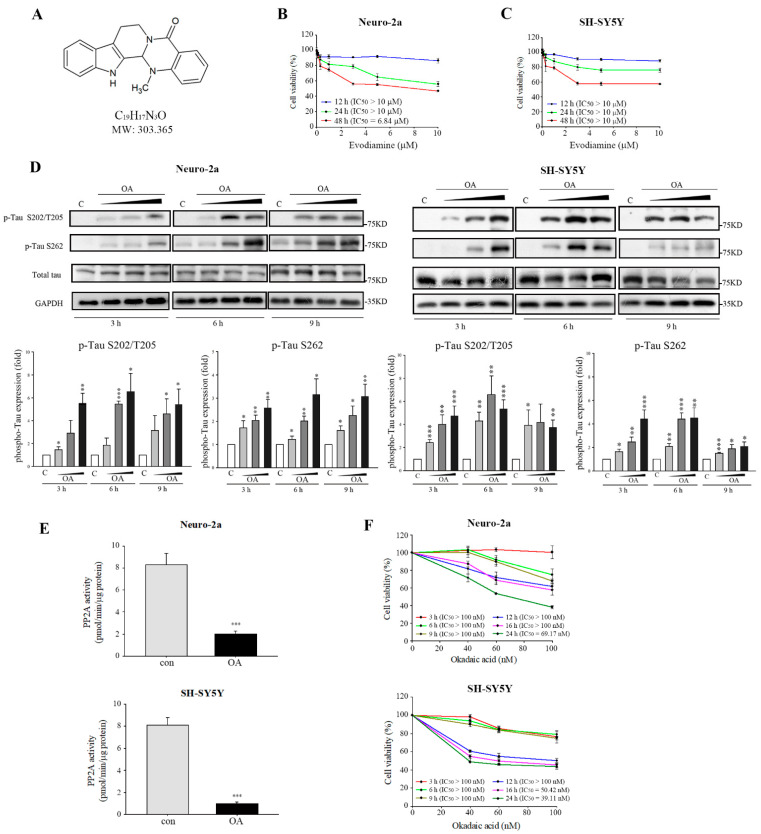
Figure 1.
Okadaic acid (OA) induced tau phosphorylation. (A) Chemical structure of evodiamine. Neuro-2a (B) and SH-SY5Y cells (C) were incubated for 24 h with or without the indicated concentrations of evodiamine, and cell viability was determined by MTT assay. (D) Neuro-2a and SH-SY5Y cells were treated without or with OA (40, 60, 100 nM) for 3, 6, or 9 h. Cell lysates were subjected to Western blot analysis using the indicated antibodies. (E) Total extracts from cells treated with OA at 60 nM for 6 h; the PP2A activity was determined using a Ser/Thr protein phosphatase assay kit. (F) Cells were incubated for 3, 6, 9, 12, 16, or 24 h with or without the indicated concentrations of OA, and cell viability was determined by MTT assay. IC50 values were calculated by a sigmoidal dose-response equation. The results are shown as the mean ± SEM from three independent experiments (ANOVA, * p < 0.05, ** p < 0.01, and *** p < 0.001 vs. control).

