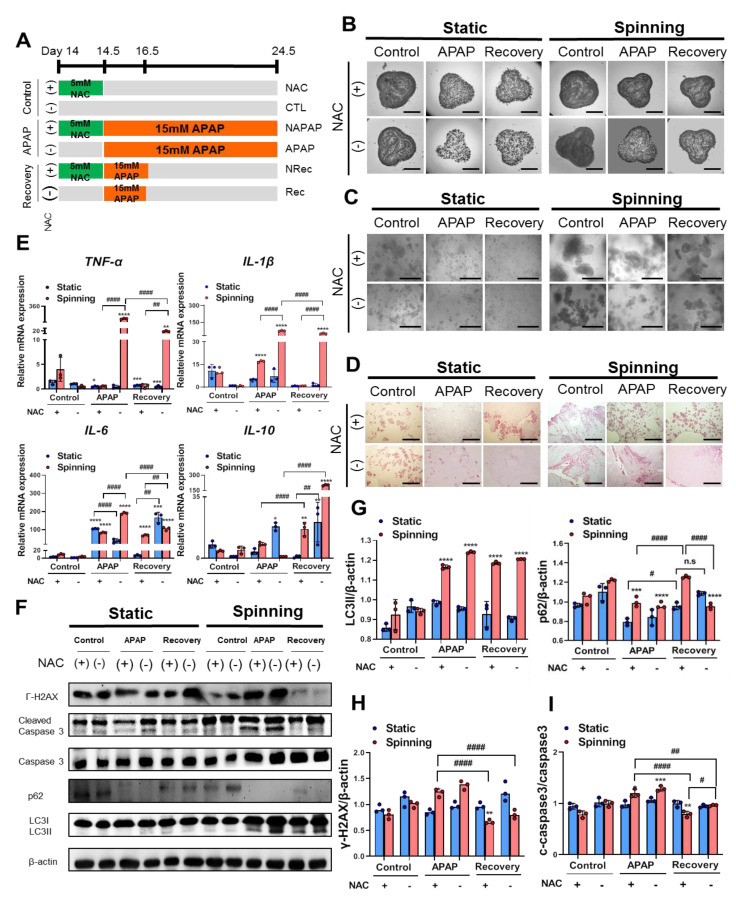
Figure 4.
Spinning condition increased APAP-induced hepatotoxicity and prevention by administration of N-acetylcysteine (NAC) in bioprinted hepatic constructs via apoptosis and autophagy signaling. (A) Schematic diagram illustrating the strategy for treatment with APAP and NAC in bioprinted hepatic constructs at the indicated time point. Groups were divided into control (without APAP for 8 days), APAP (with APAP treatment for 8 day) and recovery (with APAP treatment for 2 days and without APAP treatment after the 2nd day). Control, APAP and recovery groups were subdivided with administration of NAC for 12 h before APAP treatment in control (NAC), APAP (NAPAP) and recovery (NRec) under static or spinning conditions. (B,C) Representative bright-field images represent (B) growth of bioprinted hepatic constructs and (C) magnified self-generated spheroids in bioprinted hepatic constructs on day 24.5. (B) Scale bar = 2500 μm. (C) Scale bar = 500 μm. (D) Magnified representative H&E images of bioprinted hepatic constructs on day 24.5 after acetaminophen and NAC treatment. Scale bar = 1000 μm. (E) qRT-PCR validation of TNF-α, IL-1β, IL-6 and IL-10 inflammatory response-related genes followed by APAP and NAC treatment on day 24.5. Error bars represent the means ± S.D. from three separate experiments. One-way ANOVA followed by Bonferroni’s test was used for the statistical analysis. * p < 0.05, ** p < 0.01, *** p < 0.001 and **** p < 0.0001 represent significance between CTL and other group under indicated culture condition. ## p < 0.01 and #### p < 0.0001 show significance among each group under indicated culture condition. (F) Western blot analyses of total cell lysates from bioprinted hepatic constructs treated with NAC and APAP using anti-phospho-histone H2A.X (Ser139), anti-cleaved caspase-3, anti-caspase-3, anit-p62, anti-LC3II, anti-LC3III and anti-β-actin antibodies. β-Actin served as a loading control. (G–I) (G) Quantification of p62, LC3II and (H) pH2AX expression levels normalized to β-actin and (I) cleaved-caspase-3 expression level normalized to caspase-3. Error bars represent the means ± S.D. from three separate experiments. One-way ANOVA followed by Bonferroni’s test was used for statistical analysis. ** p < 0.01, *** p < 0.001 and **** p < 0.0001 show significance between CTL and other group under indicated culture condition, and # p < 0.05, ## p < 0.01 and #### p < 0.0001 indicate significance among each group under indicated culture condition.

