Figure 1.
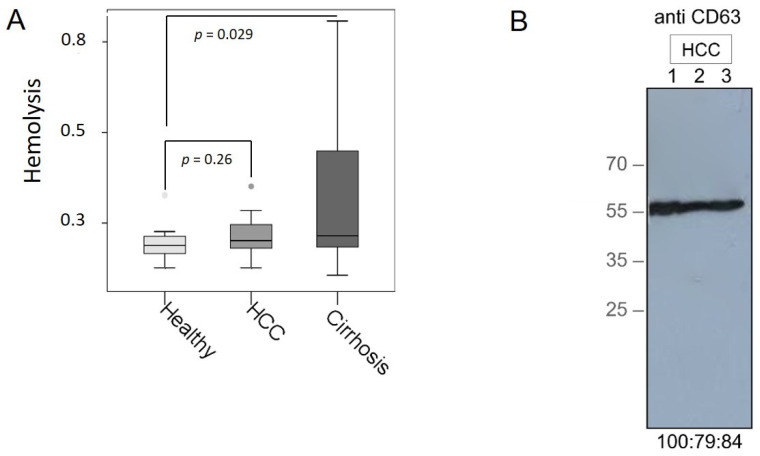
Verification of plasma samples and exosomes. Hemolysis was assessed by spectrophotometry at wavelengths from 350 to 650 nm. The degree of hemolysis was determined based on the optical density (OD) at 414 nm (absorbance peak of free hemoglobin, called Soret band), with additional peaks at 541 and 576 nm. Samples were classified as being hemolyzed if the OD at 414 exceeded 0.3. The box blot shows the levels of hemolysis in plasma samples from HCC and liver cirrhosis patients compared with those from healthy individuals with the p-values (A). Exosomes were precipitated from 3 plasma samples of HCC patients by the agglutinating agent ExoQuick and analyzed by a Western blot using an antibody specific for the exosomal marker CD63. The percentages under the blot show intensities of the areas of three bands (B).

