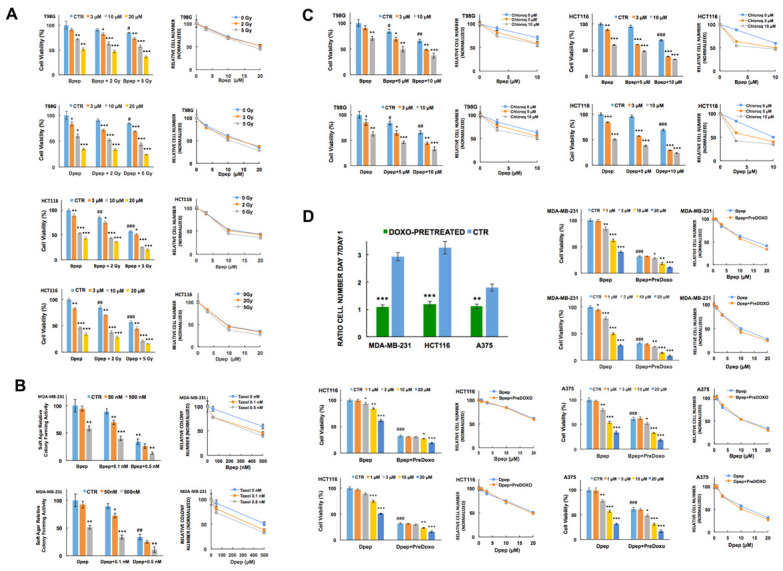
Figure 3.

Bpep and Dpep acted additively to synergistically in combination with other anti-cancer treatments and were active on non- or slowly dividing cancer cells. (A). Bpep and Dpep acted in combination with gamma radiation. Replicate cultures of T98G and HCT116 cells were subjected to 0, 2 or 5 Gy of gamma radiation and immediately thereafter, treated with 0, 3, 10 or 20 µM Bpep or Dpep for 6 days before assessment of cell numbers. Column graphs on the left show relative (to untreated control cultures) cell numbers under each condition. Line graphs on the right show cell numbers normalized in each case so that 100 represents the relative number of surviving cells that received the indicated level of radiation treatment, but no peptide treatment. Juxtaposition of data points indicates additivity while non-juxtaposition indicates potential synergism or antagonism. The figure represents one of two independent experiments with a similar outcome, each carried out in triplicate. p values for radiation treatment vs. controls (all in absence of peptides) are indicated as follows: # p < 0.05; ## p < 0.005; ### p < 0.0005. p values for peptide treatment ± irradiation vs. corresponding control are indicated by * as in the legend of Figure 1. (B). Bpep and Dpep acted in combination with Taxol on MDA-MB-231 cells as illustrated by colony-forming assays in soft agar. Replicate (n = 3) cultures were treated with 0, 0.1 or 0.5 nM Taxol in combination with 0, 50 or 500 nM Bpep or Dpep and assessed 12 days later for relative colony formation in soft agar. Data are shown on the left as relative (to untreated control cultures) colony numbers in each condition and on the right as line graphs normalized as described in panel A. p values for Taxol-treated vs. control (all in absence of peptides) are indicated by # as above. p values for peptide ± Taxol treatment vs. corresponding controls are indicated by * as in the legend of Figure 1. (C). Bpep and Dpep acted in combination with chloroquine. The graph shows data from one of two independent experiments, each in triplicate, with comparable outcomes. T98G and HCT116 cells were cultured for 6 days in the presence of indicated concentrations of Bpep and Dpep and/or chloroquine and assessed for cell numbers. Graphs on the left show relative (to untreated control cultures) cell numbers under each condition, while line graphs on right show cell numbers normalized as described in panel A. p values for chloroquine-treated vs. control (all in absence of peptides) are indicated by # as above. p values for peptide ± chloroquine treatment vs. corresponding controls are indicated by * as above. (D). Bpep and Dpep suppressed survival of non- or slowly dividing cancer cells. Replicate cultures of MDA-MB-231, HCT116 and A375 cells were pretreated for 24 h with or without 100 nM doxorubicin to inhibit proliferation and then for 6 days with the indicated concentrations of Bpep or Dpep. Data are from one experiment in triplicate. The upper left panel shows the ratios of cell numbers at the end of the experiment (day 7) compared with one day after pre-treatment with or without doxorubicin alone (day 1). p values for doxorubicin pretreated vs. control are indicated by # as above. The remaining panels show cell survival in cultures pre-treated with or without doxorubicin and/or with or without various concentrations of Bpep or Dpep. Bar graphs represent % survival relative to that observed with no treatment. Corresponding line graphs are normalized so that 100 represents the relative number of surviving cells that were pre-treated with doxorubicin, but no peptide treatment. Near-juxtaposition of data points indicates that cells retained similar sensitivity to peptides irrespective of whether or not they were pre-treated with doxorubicin. p values for control vs. doxorubicin pretreatment (all in the absence of peptides) are indicated by # as above. p values for peptide ± doxorubicin pre-treatment vs. corresponding controls are indicated by * as above. * p < 0.05, ** p < 0.005, *** p < 0.0005.
