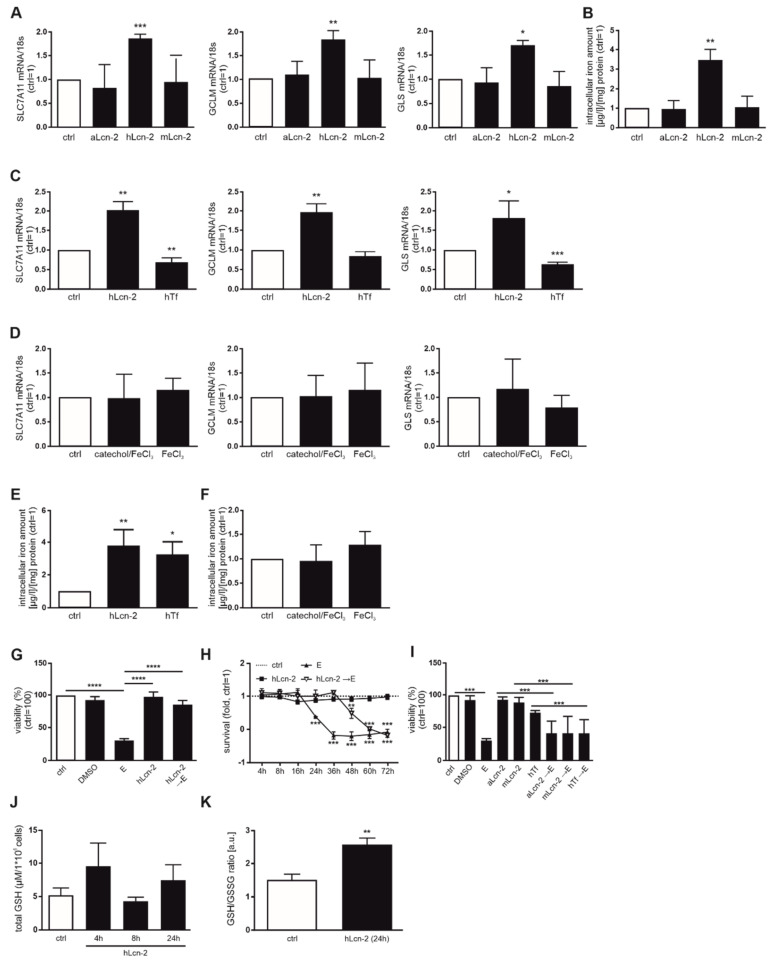
Figure 2.
hLcn-2 delays erastin-induced ferroptosis. (A) mRNA expression of SLC7A11, GCLM, and GLS after stimulation with iron-free apo-Lcn-2 (aLcn-2), holo-Lcn-2 (hLcn-2), or the no iron-binding mutant Lcn-2 (mLcn-2) (n = 4). (B) Measurement of intracellular iron amount by AAS analysis after Lcn-2 stimulation (n = 4). (C,D) SLC7A11, GCLM, and GLS mRNA expression after (C) holo-Lcn-2 (hLcn-2) compared to holo-Transferrin (hTf) (n = 4), or (D) iron-loaded catechol (catechol/FeCl3) and FeCl3. mRNA expression was normalized to housekeeping gene 18S expression (n = 4). (E,F) AAS measurements of CAKI1 cells stimulated with (E) hLcn-2 compared to hTf (n = 4) or (F) iron-loaded catechol (catechol/FeCl3) compared to FeCl3 alone (n = 4). (G,H) CAKI1 cells were pre-stimulated with hLcn-2 for 24 h, washed and incubated with erastin (10 µM) for additional 24 h. (G) Cell viability measured with CellTiter Blue assay and normalized to the unstimulated control. DMSO served as solvent control (n = 4). (H) Survival assay accomplished with xCELLigence RTCA real-time measurement. A DMSO-stimulated control served for normalization (n = 3). (I) Cell viability measured with CellTiter Blue assay and normalized to the unstimulated control. DMSO served as solvent control. CAKI1 cells were pre-stimulated with either aLcn-2, mLcn-2, or hTf for 24 h, washed and incubated with erastin for additional 24 h (n = 4). (J) Measurement of total GSH by HPLC (n = 4) as well as (K) the ratio of GSH to GSSG by a colorimetric assay in CAKI1 cells after stimulation with hLcn-2 for indicated timepoints (n = 4). Graphs are displayed as means ± SEM with * p < 0.05, ** p < 0.01, *** p < 0.001, **** p < 0.0001.

