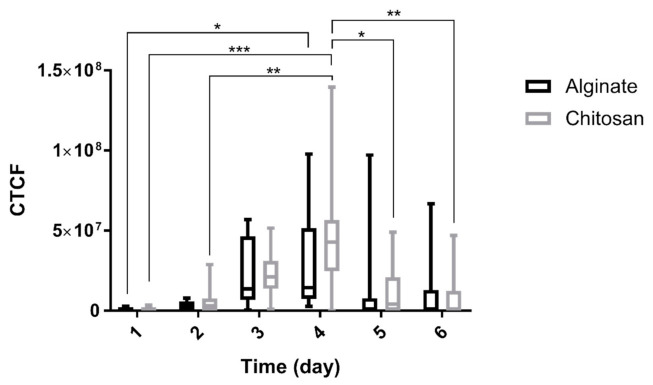
Figure 8.
Quantitative analysis of cell fluorescent recorded by confocal fluorescent microscope using alginate or chitosan as the surfactants for PLGA nanoparticles loaded with 2.5% Rhodamine B. The nanoparticles were mixed with Matrigel and organoids (1:4 V/V Nanoparticle: Matrigel suspension). More than nine organoids were measured for each sample. Differences between groups were considered significant if p-values were <0.05. (*) indicates p-values < 0.05, (**) indicates p-values < 0.01, (***) indicates p-values < 0.001.

