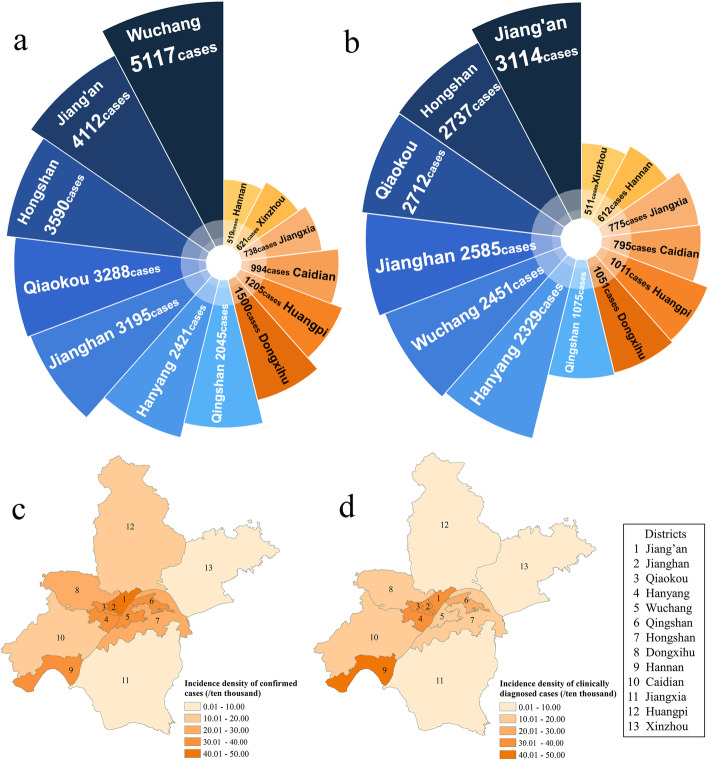
Fig. 2.
The cumulative numbers and incidence density of confirmed cases and clinically diagnosed cases with COVID-19 in 13 districts of Wuhan. (a) rose diagram of cumulative confirmed cases, (b) rose diagram of cumulative clinically diagnosed cases. The 7 districts with blue series belong to the city centers, and the 6 districts with orange series belong to the suburbs in Wuhan. (c) map of incidence density of confirmed cases, (d) map of incidence density of clinically diagnosed cases

