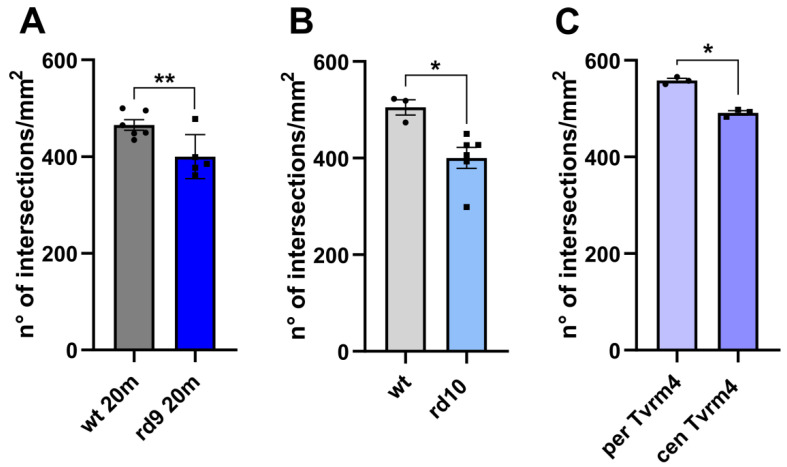
Figure 5.
Density of ZO-1-positive profiles in the RPE of different mouse models of RP. (A) Comparison between 20 m old rd9 (n = 5) and age-matched wt mice (n = 6). Unpaired t test, p = 0.0158. (B) Comparison between rd10 (n = 6) and age-matched wt mice (n = 3) (all 45–50 days old). Unpaired t test, p = 0.0168. (C) Comparison between central (cen Tvrm4, n = 3) and peripheral (per Tvrm4, n = 3) zones of the RPE of Tvrm4 mice. Paired t test, p = 0.0138. Error bars represent ±SEM. * p < 0.05, ** p < 0.01.

