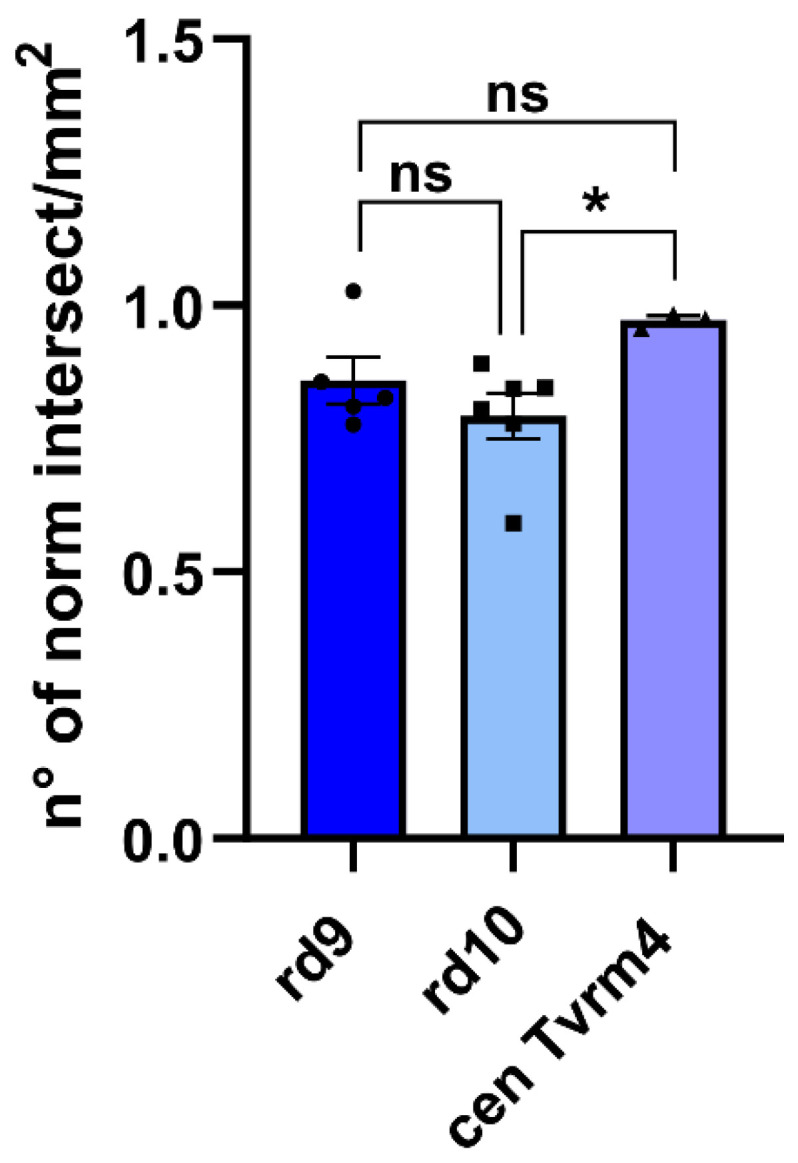
Figure 8.

ZO-1 discontinuities are a stereotyped form of RPE remodeling. Comparison among the same groups of data used to generate Figure 5, each normalized to the respective control group (i.e., wt aged 20 months for rd9 mutants; wt aged 45–50 days for rd10 mice and for central Tvrm4 RPE). One-way ANOVA p = 0.0566. Post hoc Tukey’s test. rd9 vs. rd10, p = 0.479; rd9 vs. Tvrm4, p = 0.2614; rd10 vs. Tvrm4, p = 0.0465. Error bars represent ±SEM. * p < 0.05; ns: not significant.
