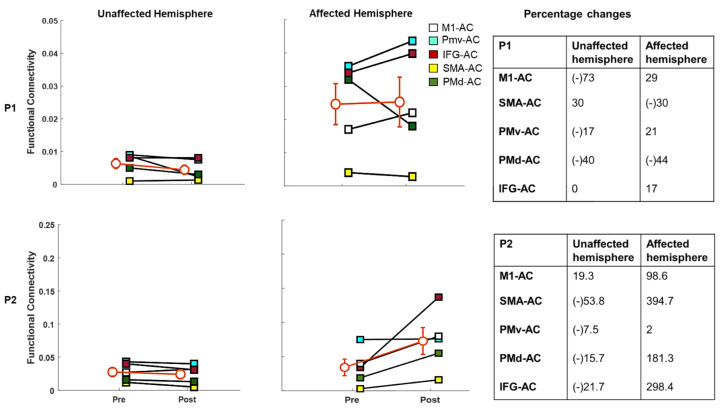
Figure 4.
Intracortical coherence in the β-band in Participant 1 and Participant 2 with percentage connectivity changes before and after MST. The error bars (i.e., orange line) represent the standard error of the mean in the overall connectivity. (M1: primary motor cortex, AC: auditory cortex, SMA: supplementary motor area: PMv: premotor ventral area, PMd: premotor dorsal area, IFG: inferior frontal gyrus, P1: Participant 1, P2: Participant 2).

