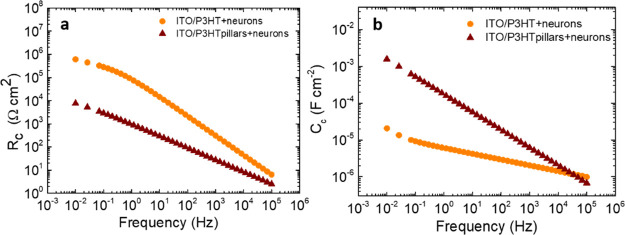
Figure 4.
Cell resistance and capacitance. Resistance (Rc) (a) and capacitance (Cc) (b) values, obtained by the combination of circuital parameters (Table S1) of the cell equivalent circuital loops depicted in Figure 3, as a function of the frequency. Rc and Cc values were normalized to the geometrical and to the estimated effective area of the sample, in the flat and pillar cases, respectively.

