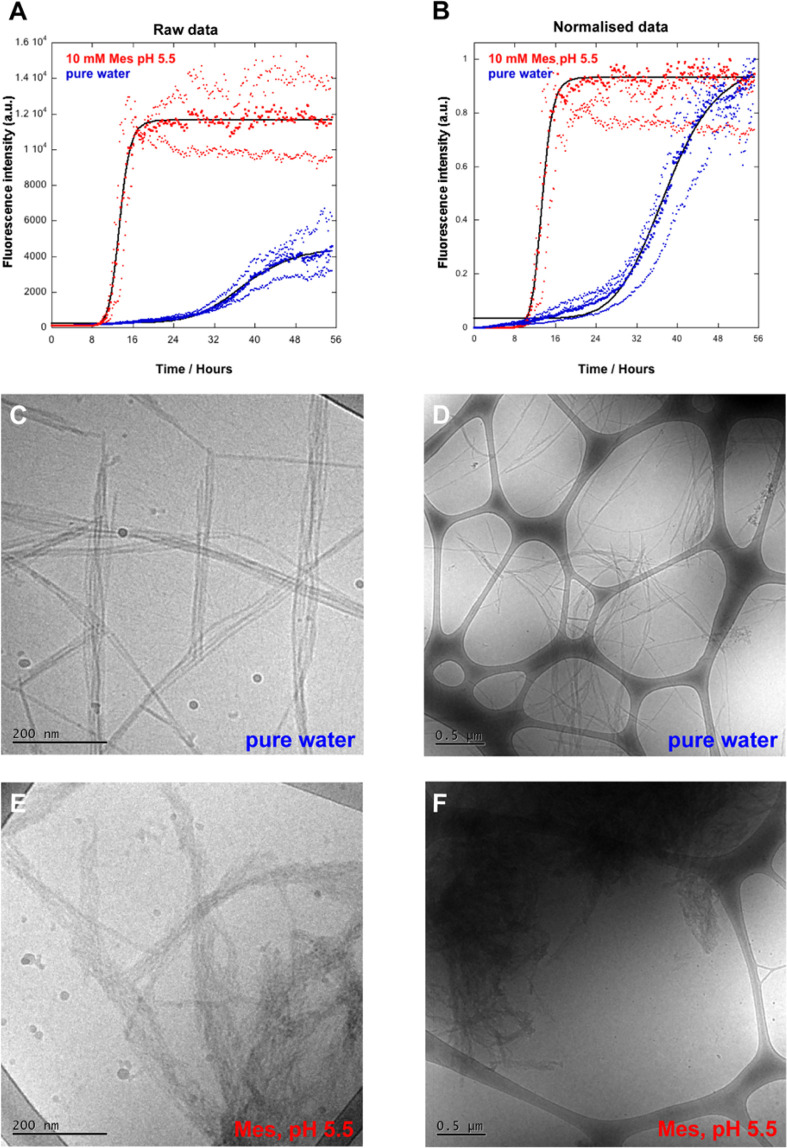
Figure 2.
Ultrastructure of α-synuclein fibrils formed in pure water and 10 mM MES/NaOH, pH 5.5. Fibrils were formed by incubating the monomeric α-synuclein in a nontreated polystyrene plate at quiescent conditions. Samples were supplemented with 20 μM ThT and the fluorescence intensity measured at different time points. The protein concentration was 35 μM. (A) Raw data. Red: 10 mM MES/NaOH (pH 5.5), t1/2 = 13.4 h, two replicates. Blue: in pure water, t1/2 = 38.0 h, four replicates. The bold dots show the average of the replicates. Individual replicates are shown with thinner dots. The t1/2 was calculated by fitting a sigmoidal curve to the average data. (B) Normalized data, same method and data as those in A. Cryo-TEM images of the α-synuclein fibril samples collected after reaching the plateau in ThT fluorescence. (C and D) α-Synuclein fibrils formed in water. (E and F) α-Synuclein fibrils formed in 10 mM MES, pH 5.5.

