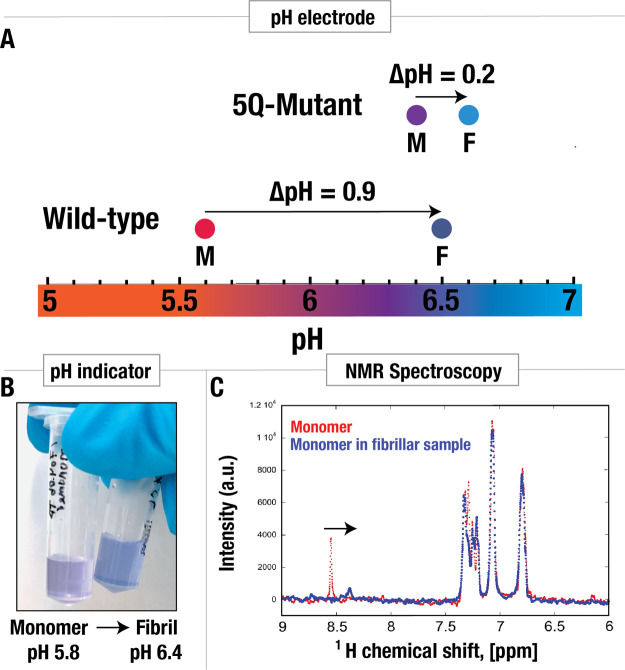
Figure 3.
Change in pH during amyloid formation of wild-type α-synuclein and an α-synuclein 5Q mutant. (A) pH change during amyloid formation detected by pH electrode. The proteins (wild-type α-synuclein and the 5Q mutant) were isolated in pure water, and pH was measured before and after fibril formation. On average, pH changed from pH 5.6 to pH 6.5 for the wild-type protein and on average from pH 6.4 to 6.6 for the 5Q mutants. (B) pH change detected using the pH sensitive dye, resazurin. Monomeric α-synuclein in weak buffer containing resazurin, at pH 5.8, resulted in purple color. The fibrillar sample gave rise to blue color. For comparison, the pH was measured to be 6.4 using a pH electrode. (C) pH change detected using NMR spectroscopy using the δ2 proton of histidine in monomeric α-synuclein as a pH sensor. The red and blue traces show the spectrum before and after fibril formation, respectively. The large decrease in chemical shift detected for the monomer in the fibrillar sample is indicative of a pH increase.

