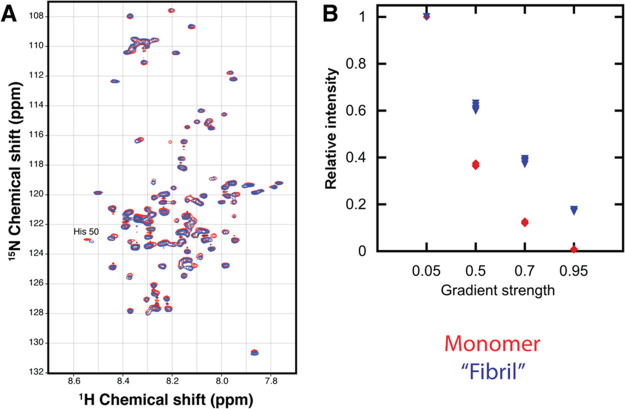
Figure 5.
(A) 2D 15N-1H HSQC NMR spectra of 15N labeled α-synuclein in 5% D2O/95% H2O. (B) Relative intensities from diffusion ordered (DOSY) NMR spectra. Monomer signals in the absence of fibril are shown in red (diamonds in B), and in the presence of fibrils in blue (triangles in B). In B, the signal intensity is calculated relative to the intensity at a gradient strength of 0.05 of max strength.

