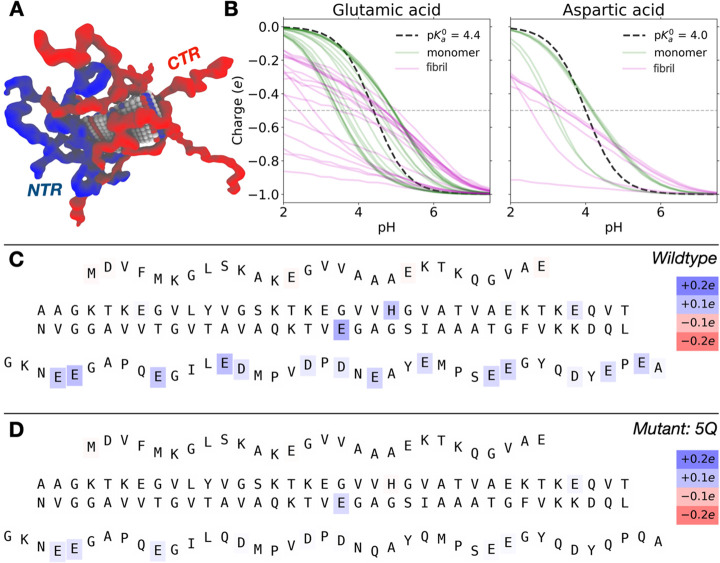
Figure 7.
Results from Monte Carlo simulations of α-synuclein monomer and fibril (10 planes of a fibril as found in PDB: 2N0A) states. (A) Snapshot showing the rigid middle part of the fibril, flanked by flexible N-termini (blue) and C-termini (red). (B) Partial charge of carboxyl groups of glutamic acid and aspartic acid in the fibril (magenta) and in the monomer (green) as a function of pH. The dashed, black line shows the nonperturbed titration curve given by the model pKa0 value. (C) Differences in residue partial charges between α-synuclein in a monomer and in a fibril at constant pH 6.5. Shifts (charge in fibrillar minus charge in monomeric state) are indicated by the colorbars and letters correspond to the amino acid sequence with a rigid middle part surrounded by flexible (shown in “wavy” text) N-terminal and C-terminal parts. (D) Same as (C), but for the 5Q-mutant.

