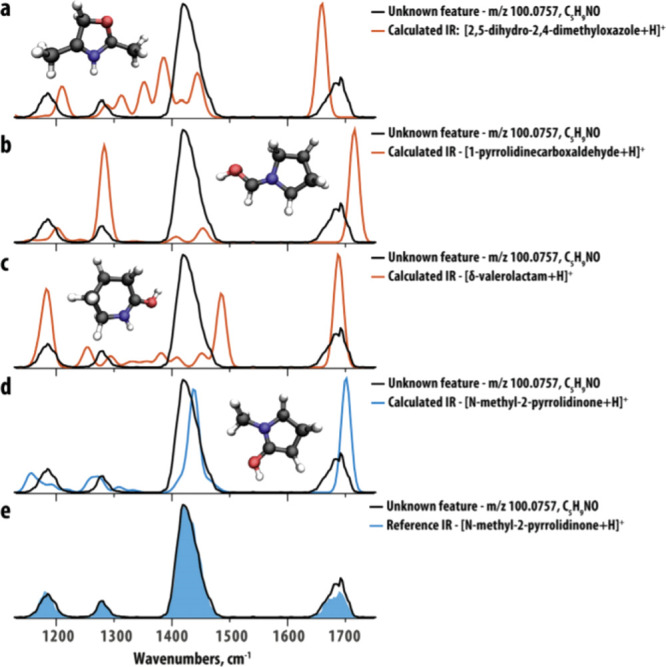
Figure 11.

Computed IR spectra (colored traces, a–d) of potential candidate structures resulting from a database search for an unknown feature at m/z 100.0757 compared to the IRIS spectrum of the unknown feature (black trace) from the patient sample. (e) Compares the IR spectrum of the reference compound N-methyl-2-pyrrolidinone identified by the match found for the predicted spectrum. Reproduced with permission from ref (269). Copyright 2020 Elsevier.
