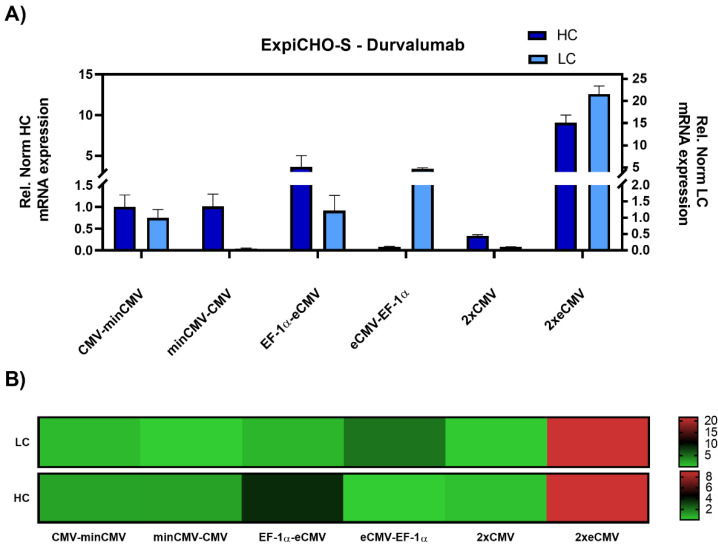
Figure 4.
Gene expression analysis of heavy and light chain genes after transient transfection of Durvalumab in ExpiCHO-S cells. (A) Bar chart representing heavy (dark blue) and light (light blue) chain mRNA expression in the different constructs. Values are relative to the CMV-minCMV construct and normalised to housekeeping genes GAPDH and RPLP0. Error bars represent the standard error of the mean of technical triplicates. (B) Heat map representation of gene expression analysis. The relative normalised gene expression for light and heavy chain mRNA is shown on the right with their respective scales.

