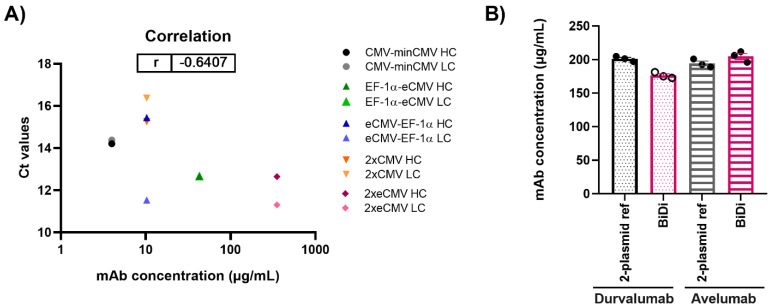
Figure 6.
(A) Correlation of mAb concentration and Ct values for both heavy and light chain expression in Expi293-F for production of Durvalumab. (B) Quantification of antibody concentration for the production of Durvalumab and Avelumab using either a 2-plasmid reference or the BiDi 2xeCMV construct. Error bars represent the standard error of the mean of biological triplicates, while the symbols represent the individual measurements.

