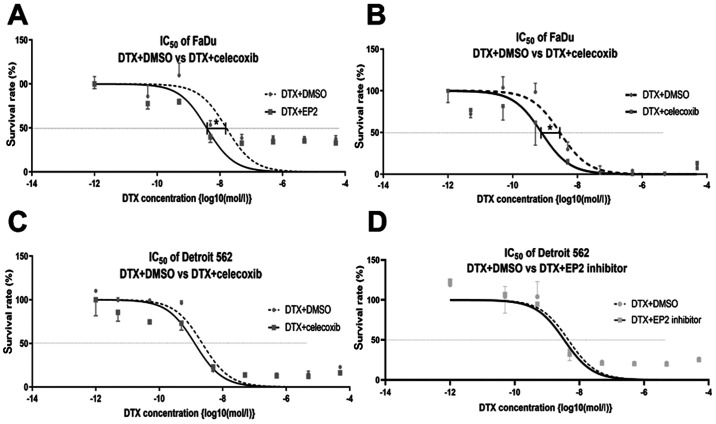
Figure 3.
Cell survival rate curves of hypopharyngeal carcinoma cells. DTX concentration is shown as log10(mol/l). FaDu cells treated with (A) DTX + 5 µM celecoxib or (B) DTX + EP2 inhibitor. Detroit 562 cells treated with (C) DTX + 5 µM celecoxib or (D) DTX + EP2 inhibitor. IC50 decreased significantly by addition of celecoxib in FaDu cells, but not in Detroit 562 cells. *P<0.05. DTX, docetaxel; EP2, prostaglandin E receptor 2.

