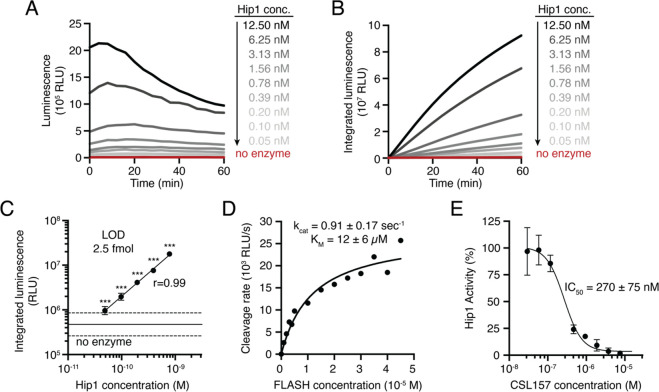
Figure 2.
FLASH is a sensitive probe for Mtb Hip1 activity. (A) Light emitted by the FLASH probe upon incubation with various concentrations of Mtb Hip1. (B) Time course of integrated luminescence from part A. (C) Total integrated luminescence after 1 h of incubation with Mtb Hip1 (mean ± SD, n = 3). Horizontal lines show the mean (solid) ± 3 SD (dashed) of control samples lacking enzyme. Each enzyme concentration was compared to the control samples via one-way ANOVA with Dunnett’s test (***, p < 0.001). The best fit line shows linear regression to the log-transformed data. (D) Kinetic analysis of the FLASH probe. Data were fitted to the Michaelis–Menten equation to yield kinetic parameters. (E) Inhibition of Mtb Hip1 by CSL157 (mean ± SD, n = 3). Mtb Hip1 was preincubated with inhibitor for 30 min at 37 °C before the addition of the FLASH probe. Data were fitted to a four-parameter logistic equation to yield IC50. All parameters are reported as the 95% confidence interval.

